Investment Grade CDS Market Summary – July 2024
GET OUR CDS MARKET SUMMARIES STRAIGHT TO YOUR INBOX. LEARN MORE
Investment Grade CDS Market july 2024
Our newsletter presents key trends derived from observable Credit Default Swaps pricing data over a monthly period.
Top 10 Outperformers
Showcases the top 10 IG CDS “outperformers” based on the largest mid spread decreases between 7/1/24 – 7/31/24
| RANK | BOND NAME | ISSUER | % CHANGE | BPS CHANGE | SPRD | SPRD-1 MONTH | DEALERS |
|---|---|---|---|---|---|---|---|
| 1 | HMSOLN 5Y | HAMMERSON PLC | -31.3% | -29 | 65 | 94 | 3 |
| 2 | TOL 5Y | TOLL BROS INC | -25.6% | -23 | 66 | 89 | 4 |
| 3 | PHM 5Y | CENTEX CORP | -17.7% | -13 | 60 | 73 | 4 |
| 4 | LEN 5Y | LENNAR CORP | -17.4% | -13 | 60 | 73 | 4 |
| 5 | EDF 5Y | EDF S A | -16.3% | -13 | 67 | 80 | 7 |
| 6 | RDN 5Y | RADIAN GROUP INC | -16.2% | -16 | 84 | 101 | 4 |
| 7 | NUE 5Y | NUCOR CORP | -15.5% | -14 | 76 | 90 | 2 |
| 8 | ENEL 5Y | ENEL SPA | -15.3% | -10 | 54 | 64 | 5 |
| 9 | BAYGR 5Y | BAYER CORP | -14.5% | -15 | 89 | 104 | 6 |
| 10 | HOTGR 5Y | HOCHTIEF AG | -13.9% | -14 | 86 | 100 | 6 |
Top 10 Underperformers
Showcases the top 10 IG CDS “underperformers” based on the largest mid spread increases between 7/1/24 – 7/31/24
| RANK | BOND NAME | ISSUER | % CHANGE | BPS CHANGE | SPRD | SPRD-1 MONTH | DEALERS |
|---|---|---|---|---|---|---|---|
| 1 | WHR 5Y | MAYTAG CORP | 40.2% | 40 | 138 | 98 | 6 |
| 2 | RENTOKIL 5Y | RENTOKIL GROUP PLC | 34.1% | 18 | 72 | 53 | 4 |
| 3 | VIVFP 5Y | SEAGRAM CO LTD | 16.0% | 9 | 63 | 55 | 7 |
| 4 | DELL 5Y | DELL COMPUTER CORP | 14.1% | 7 | 56 | 49 | 4 |
| 5 | MMBFP 5Y | LAGARDERE SCA | 13.8% | 11 | 90 | 79 | 4 |
| 6 | DRI 5Y | DARDEN RESTAURANTS INC | 11.9% | 5 | 52 | 46 | 4 |
| 7 | CMCSA 5Y | AT&T BROADBAND CORP | 8.5% | 4 | 50 | 46 | 5 |
| 8 | ACCOR 5Y | ACCOR SA | 8.1% | 5 | 69 | 64 | 6 |
| 9 | SZUGR 5Y | SUEDZUCKER AG | 7.7% | 5 | 67 | 62 | 6 |
| 10 | HAOHUA 5Y | CNAC CENTURY HK CO LTD | 7.2% | 6.0 | 89 | 83 | 3 |
Normalized IG Spread by Region
Displays the IG CDS spread by region between 7/1/24 – 7/31/24 Results are based on 5 select regions, however, we offer data across 12 regions

IG Spread by Region – Monthly Comparison
Exhibits the IG mid spread by region for the month ending 6/30/23 vs. the month ending 7/31/24
| REGION | PREVIOUS SPREAD | CURRENT SPREAD | BPS CHANGE | MONTHLY PERFORMANCE | CDS COUNT |
|---|---|---|---|---|---|
| Global | 51 | 50 | -1 | Tighter | 589 |
| U.S. | 51 | 50 | -1 | Tighter | 250 |
| Japan | 31 | 33 | 2 | Wider | 38 |
| U.K. | 57 | 56 | -1 | Tighter | 40 |
| China | 69 | 65 | -4 | Tighter | 9 |
| APAC | 46 | 44 | -1 | Tighter | 41 |
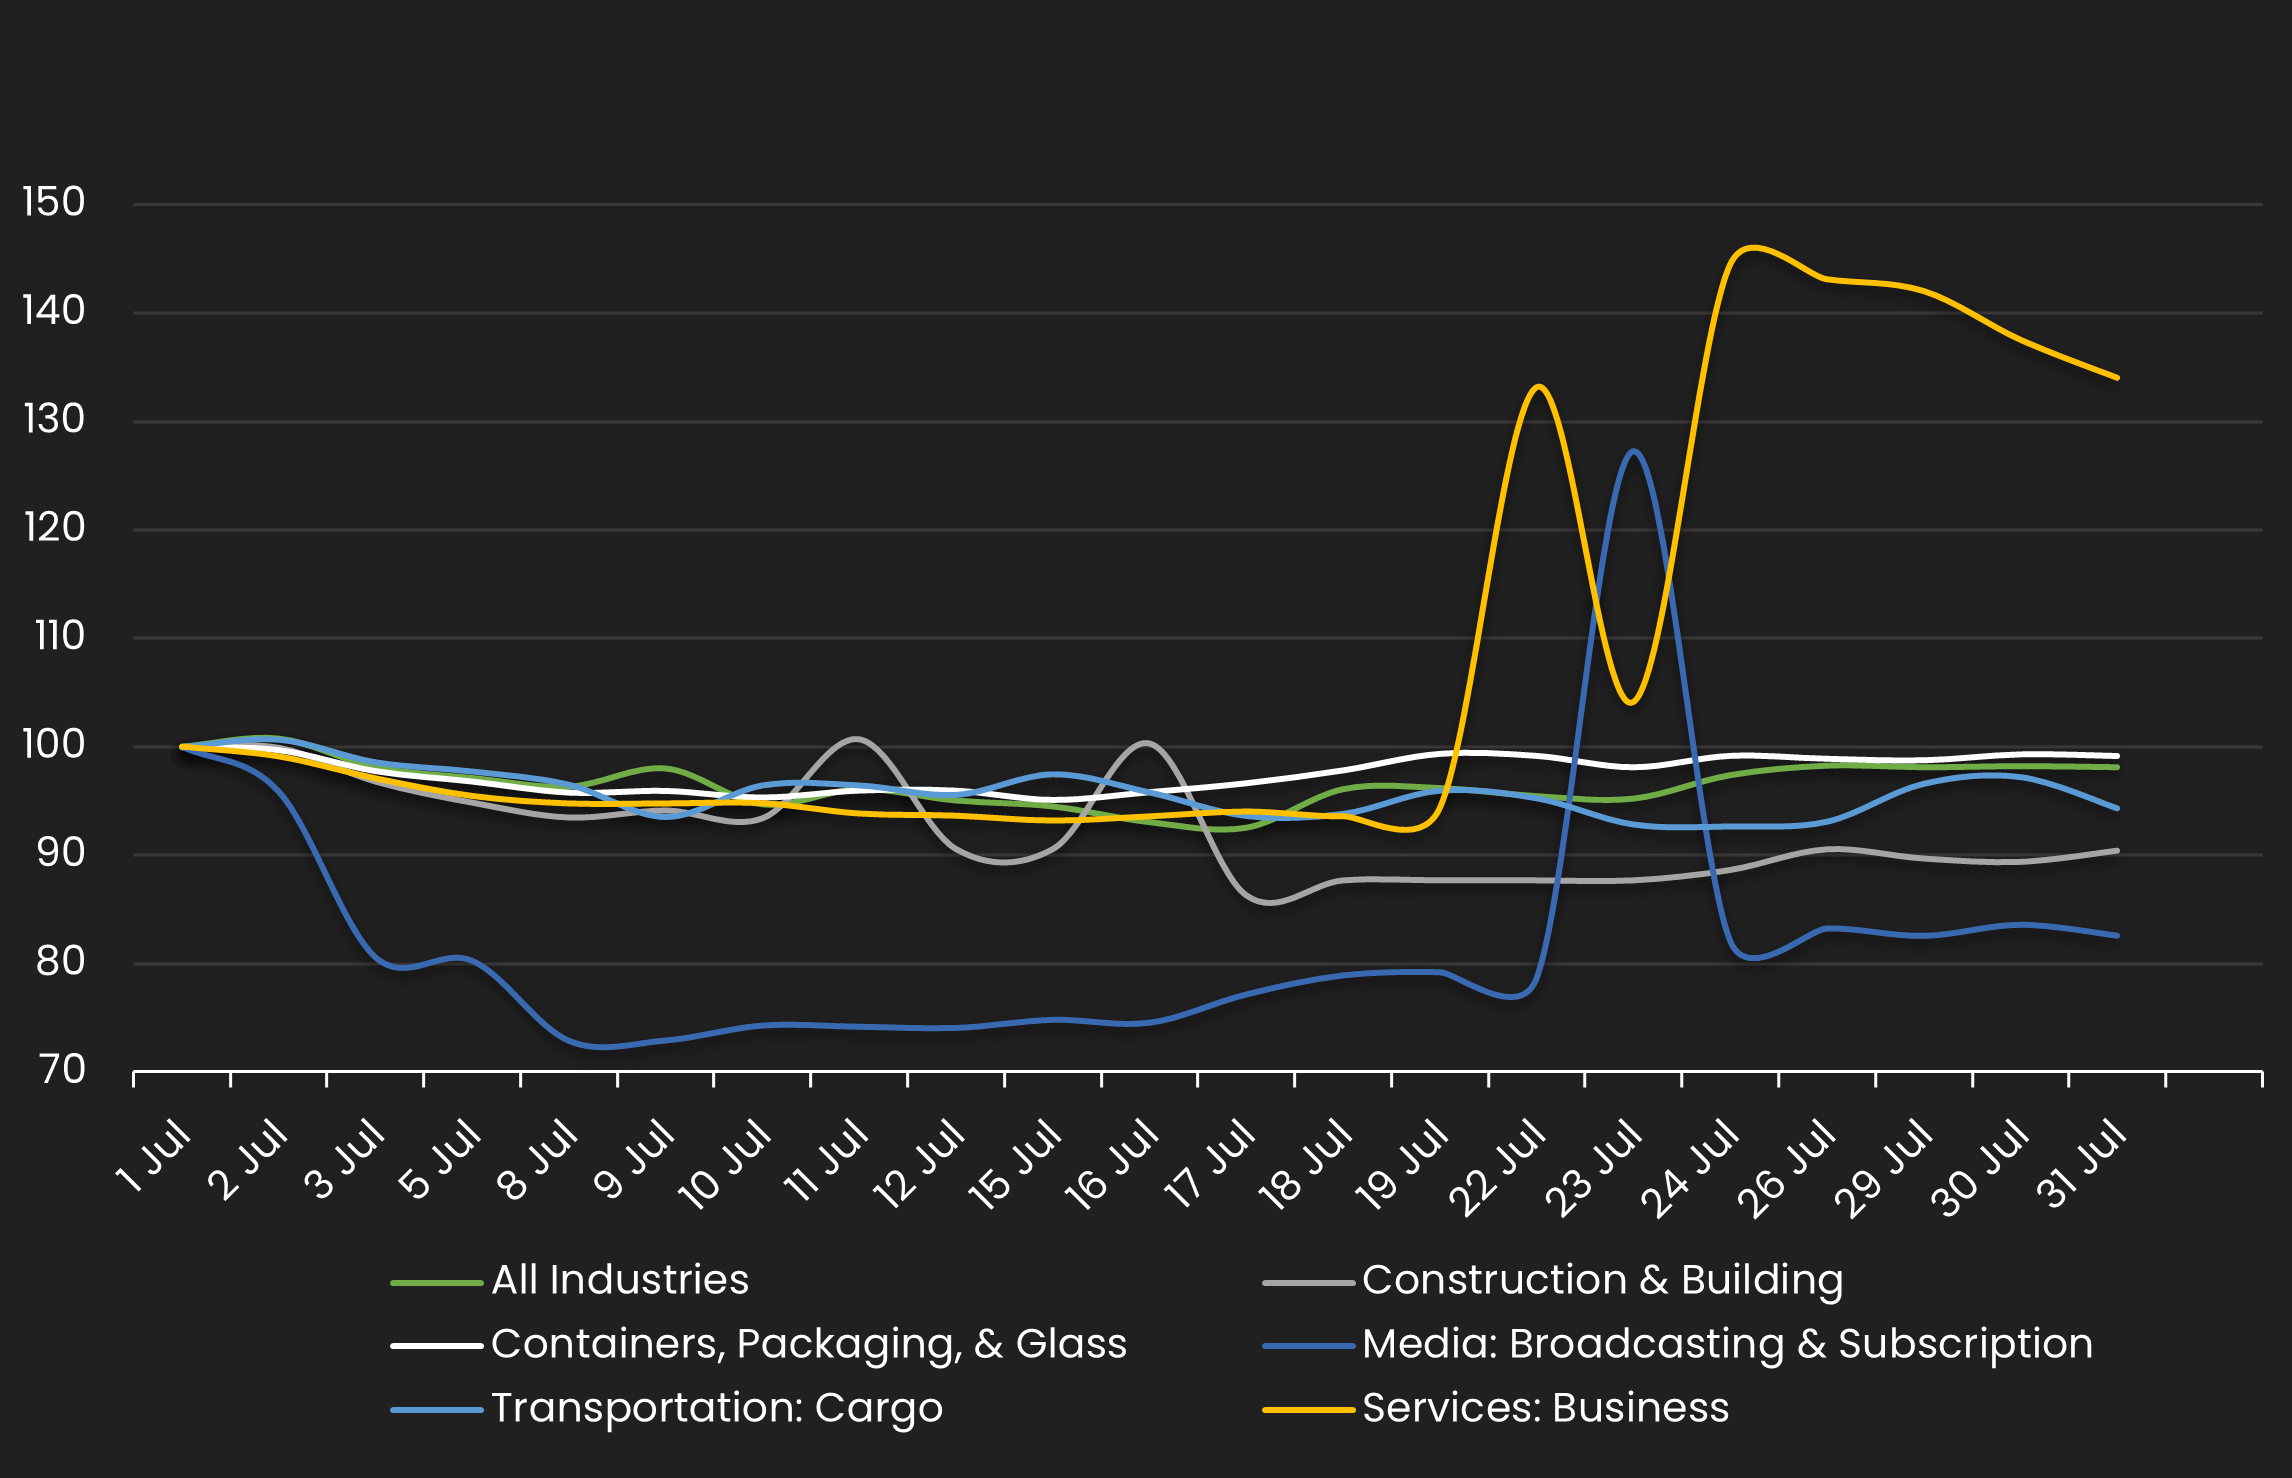
Normalized IG Spread by Industry
Displays the IG CDS spread by industry between 7/1/24 – 7/31/24 Results are based on 5 select industry sectors, however, we offer data across 36 sectors
IG Spread by Industries – Monthly Comparison
Exhibits the IG spread by industry for the month ending 6/30/23 vs. the month ending 7/31/24
| INDUSTRIES | PREVIOUS SPREAD | CURRENT SPREAD | BPS CHANGE | MONTHLY PERFORMANCE | CDS COUNT |
|---|---|---|---|---|---|
| All Industries | 51 | 50 | -1 | Tighter | 590.00 |
| Construction & Building | 51 | 47 | -5 | Tighter | 13.00 |
| Containers, Packaging, & Glass | 30 | 30 | 0 | Tighter | 2.00 |
| Media: Broadcasting & Subscription | 147 | 121 | -26 | Tighter | 2.00 |
| Transportation: Cargo | 25 | 24 | -1 | Tighter | 14.00 |
| Services: Business | 53 | 72 | 18 | Wider | 3.00 |
Stay up-to-date with monthly summaries.
Related Resources
About SOLVE
SOLVE is the leading market data platform provider for fixed-income securities, trusted by sophisticated buy-side and sell-side firms worldwide. Founded in 2011, SOLVE leverages its AI-driven technology and deep industry expertise to offer unparalleled transparency into markets, reduce risk, and save hundreds of hours across front-office workflows. With the largest real-time datasets for Securitized Products, Municipal Bonds, Corporate Bonds, Syndicated Bank Loans, Convertible Bonds, CDS, and Private Credit, SOLVE empowers clients to transform the way they bring new securities to market, trade on secondary markets, and value highly illiquid securities. Headquartered in Connecticut, with offices across the globe, SOLVE is the definitive source for market pricing in fixed-income markets.
