Investment Grade CDS Market Summary – January 2025
GET OUR CDS MARKET SUMMARIES STRAIGHT TO YOUR INBOX. LEARN MORE
Investment Grade CDS Market January 2025
Our newsletter presents key trends derived from observable Credit Default Swaps pricing data over a monthly period.
Top 10 Outperformers
Showcases the top 10 IG CDS “outperformers” based on the largest mid spread decreases between 1/1/25 – 1/31/25
| RANK | BOND NAME | ISSUER | % CHANGE | BPS CHANGE | SPRD | SPRD-1 MONTH | DEALERS |
|---|---|---|---|---|---|---|---|
| 1 | HYUELE 5Y | HYNIX SEMICONDUCTOR INC | -25.6% | -21 | 61 | 82 | 3 |
| 2 | CVS 5Y | CVS CAREMARK CORP | -24.1% | -21 | 67 | 88 | 6 |
| 3 | INTC 5Y | INTEL | -18.2% | -16 | 73 | 89 | 5 |
| 4 | BBPMSPA 5Y | BANCO BPM S.P.A | -18.0% | -14 | 61 | 75 | 2 |
| 5 | VIVFP 5Y | SEAGRAM CO LTD | -17.9% | -15 | 70 | 86 | 6 |
| 6 | BA 5Y | BOEING CAP CORP INTERNOTES | -17.1% | -19 | 91 | 110 | 6 |
| 7 | NKE 5Y | NIKE INC MEDIUM TERM NTS BOOK | -16.7% | -11 | 54 | 65 | 2 |
| 8 | CHGRID 5Y | STATE GRID CORPORATION OF CHINA | -15.9% | -11 | 59 | 70 | 3 |
| 9 | BRCORO 5Y | BRISA CONCESSAO RODOVIARIA SA | -15.8% | -18 | 95 | 113 | 2 |
| 10 | AKZANA 5Y | ICI WILMINGTON INC | -15.5% | -11 | 60 | 71 | 6 |
Top 10 Underperformers
Showcases the top 10 IG CDS “underperformers” based on the largest mid spread increases between 1/1/25 – 1/31/25
| RANK | BOND NAME | ISSUER | % CHANGE | BPS CHANGE | SPRD | SPRD-1 MONTH | DEALERS |
|---|---|---|---|---|---|---|---|
| 1 | SWEMAT 5Y | SWEDISH MATCH AB | 43.3% | 25 | 83 | 58 | 2 |
| 2 | AMT 5Y | AMERICAN TOWER CORP | 27.6% | 8 | 36 | 29 | 3 |
| 3 | HSBC 5Y | HSBC BK USA N A MC LEAN VA | 22.0% | 9 | 47 | 39 | 5 |
| 4 | MRO 5Y | MARATHON GLOBAL FDG CORP | 21.2% | 9 | 50 | 41 | 3 |
| 5 | SUNHUN 5Y | SUN HUNG KAI PPTYS LTD | 15.3% | 13 | 95 | 82 | 4 |
| 6 | SYY 5Y | SYSCO CORP | 15.2% | 8 | 60 | 53 | 2 |
| 7 | EXIMBK 5Y | EXIMBANK INDIA | 14.9% | 8 | 60 | 52 | 3 |
| 8 | AVGO 5Y | AVAGO TECHNOLOGIES FINANCE PTE LTD | 13.7% | 5 | 38 | 33 | 4 |
| 9 | TENCNT 5Y | TENCENT HLDGS LTD | 13.5% | 11 | 93 | 82 | 3 |
| 10 | ERICB 5Y | TELEFONAKTIEBOLAGET LM ERICSSON | 12.6% | 7.8 | 70 | 62 | 6 |
Normalized IG Spread by Region
Displays the IG CDS spread by region between 1/1/25 – 1/31/25 Results are based on 5 select regions, however, we offer data across 12 regions
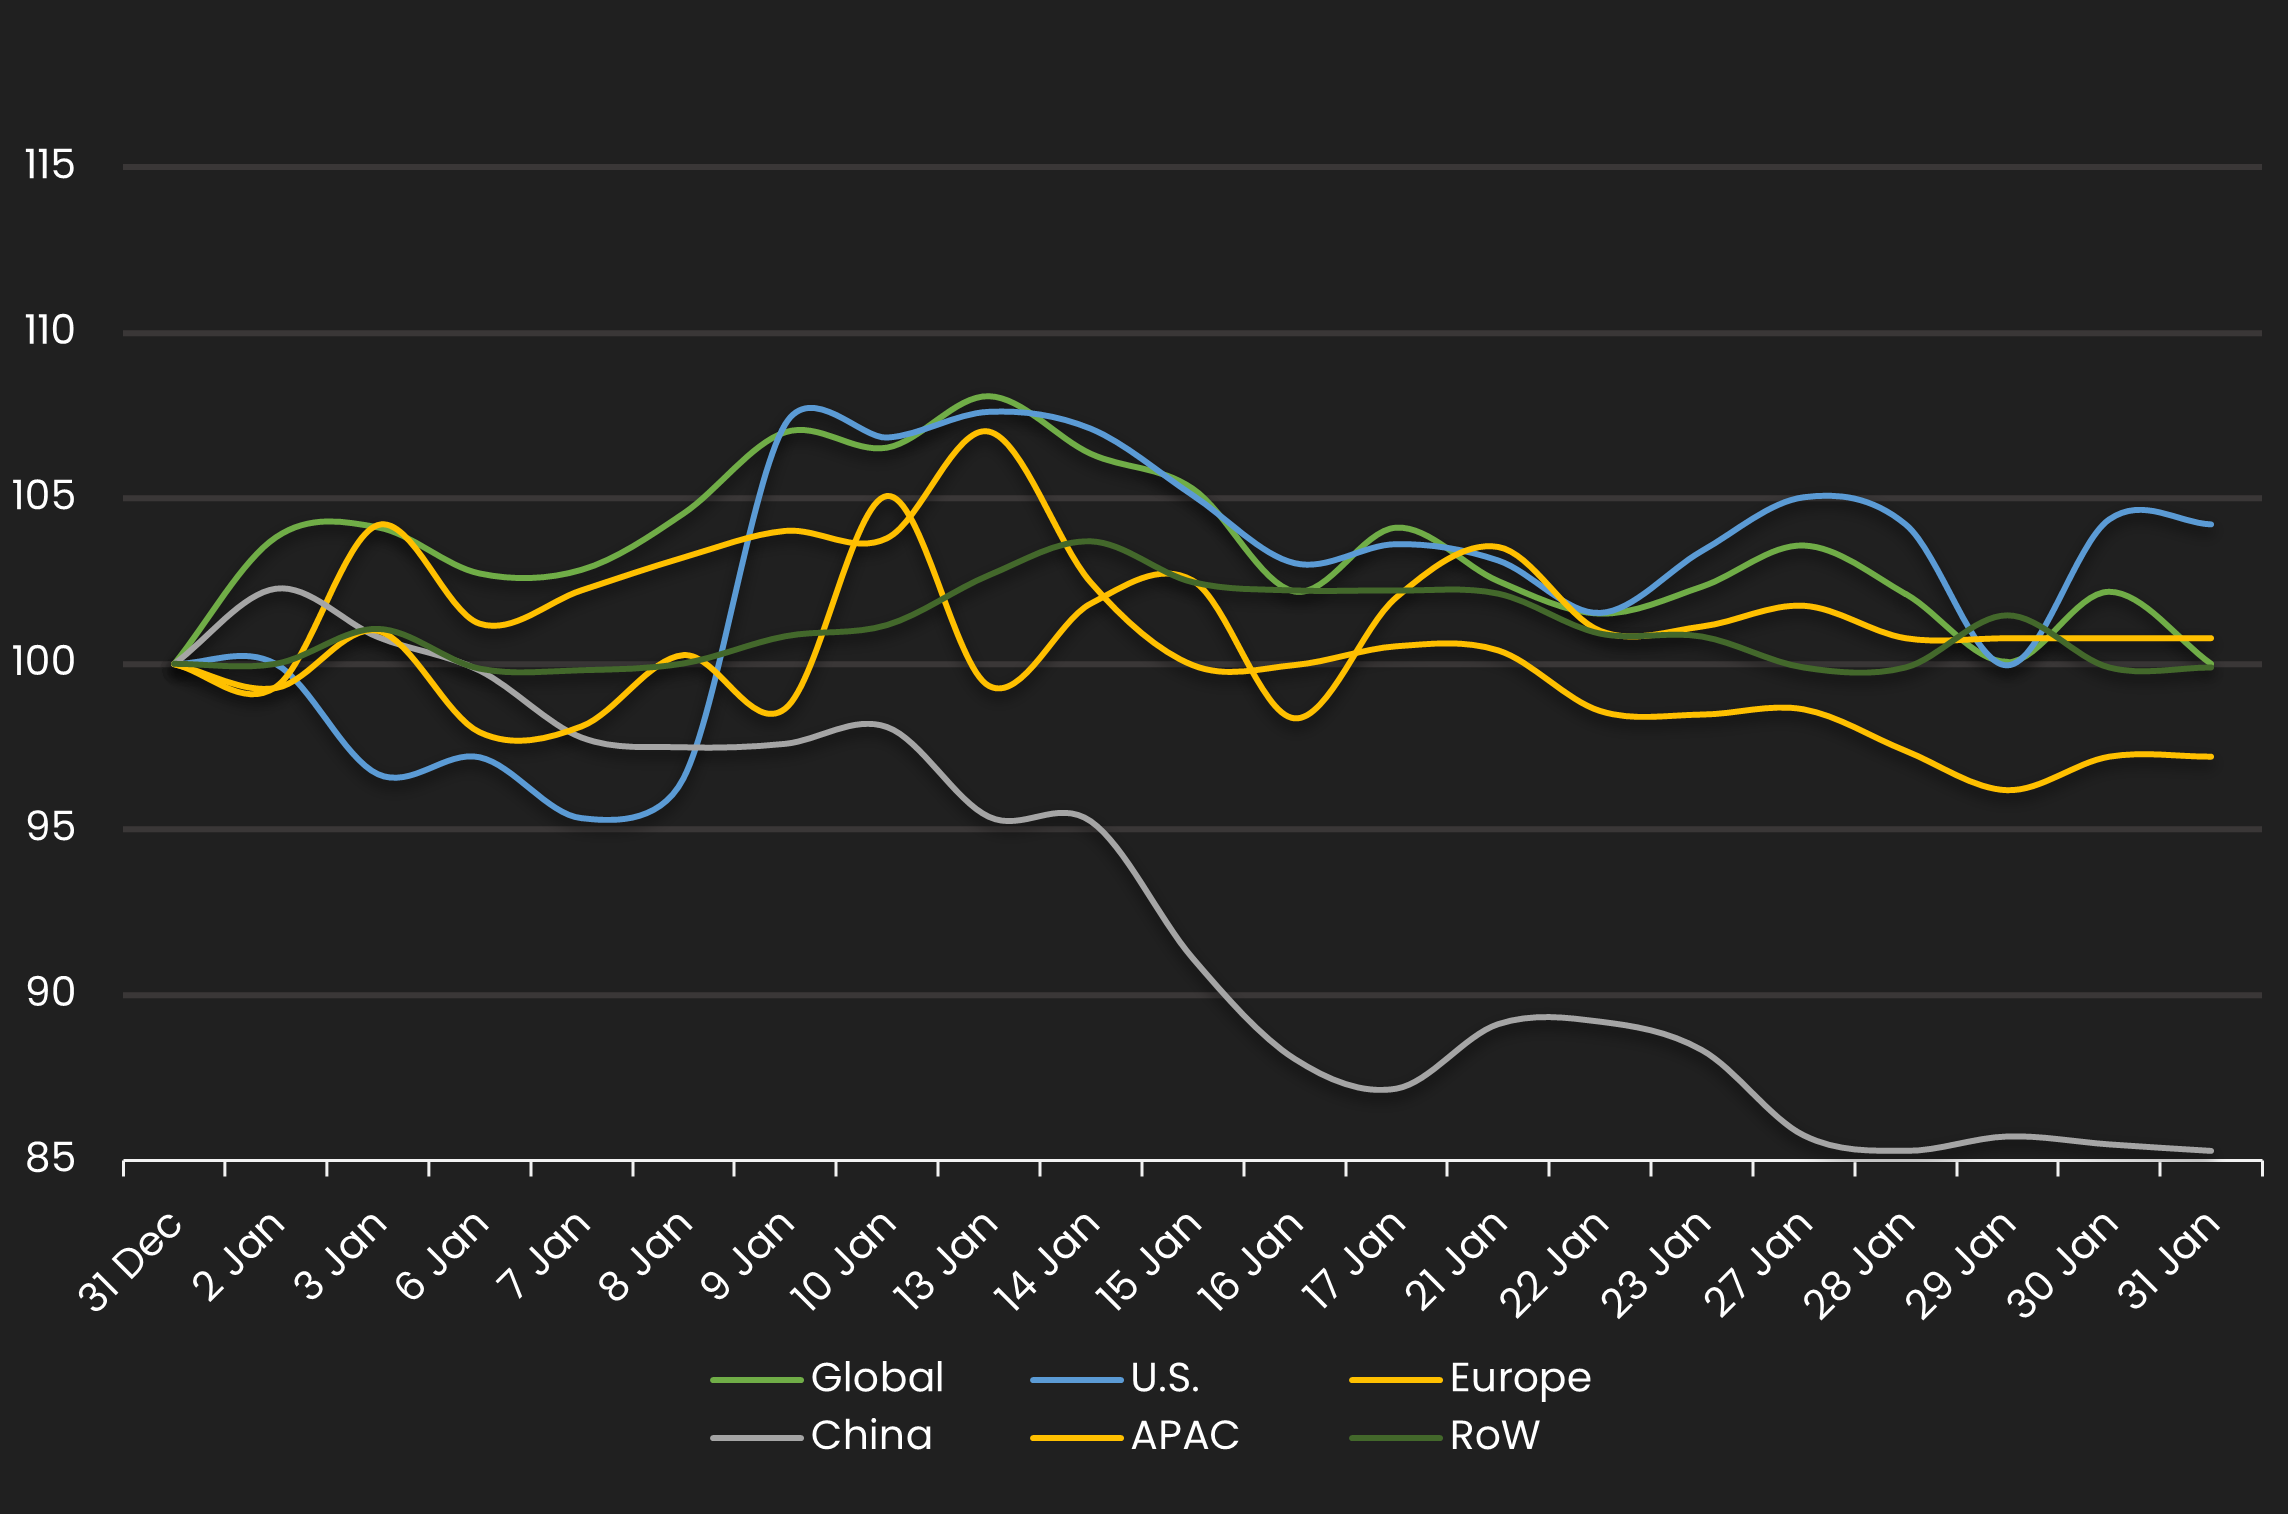
IG Spread by Region – Monthly Comparison
Exhibits the IG mid spread by region for the month ending 12/31/24 vs. the month ending 1/31/25
| REGION | PREVIOUS SPREAD | CURRENT SPREAD | BPS CHANGE | MONTHLY PERFORMANCE | CDS COUNT |
|---|---|---|---|---|---|
| Global | 48 | 48 | 0 | Wider | 614 |
| U.S. | 44 | 46 | 2 | Wider | 241 |
| Europe | 48 | 47 | -1 | Tighter | 158 |
| China | 66 | 56 | -10 | Tighter | 9 |
| APAC | 52 | 52 | 0 | Wider | 47 |
| RoW | 71 | 71 | 0 | Tighter | 11 |
Normalized IG Spread by Industry
Displays the IG CDS spread by industry between 1/1/25 – 1/31/25 Results are based on 5 select industry sectors, however, we offer data across 36 sectors
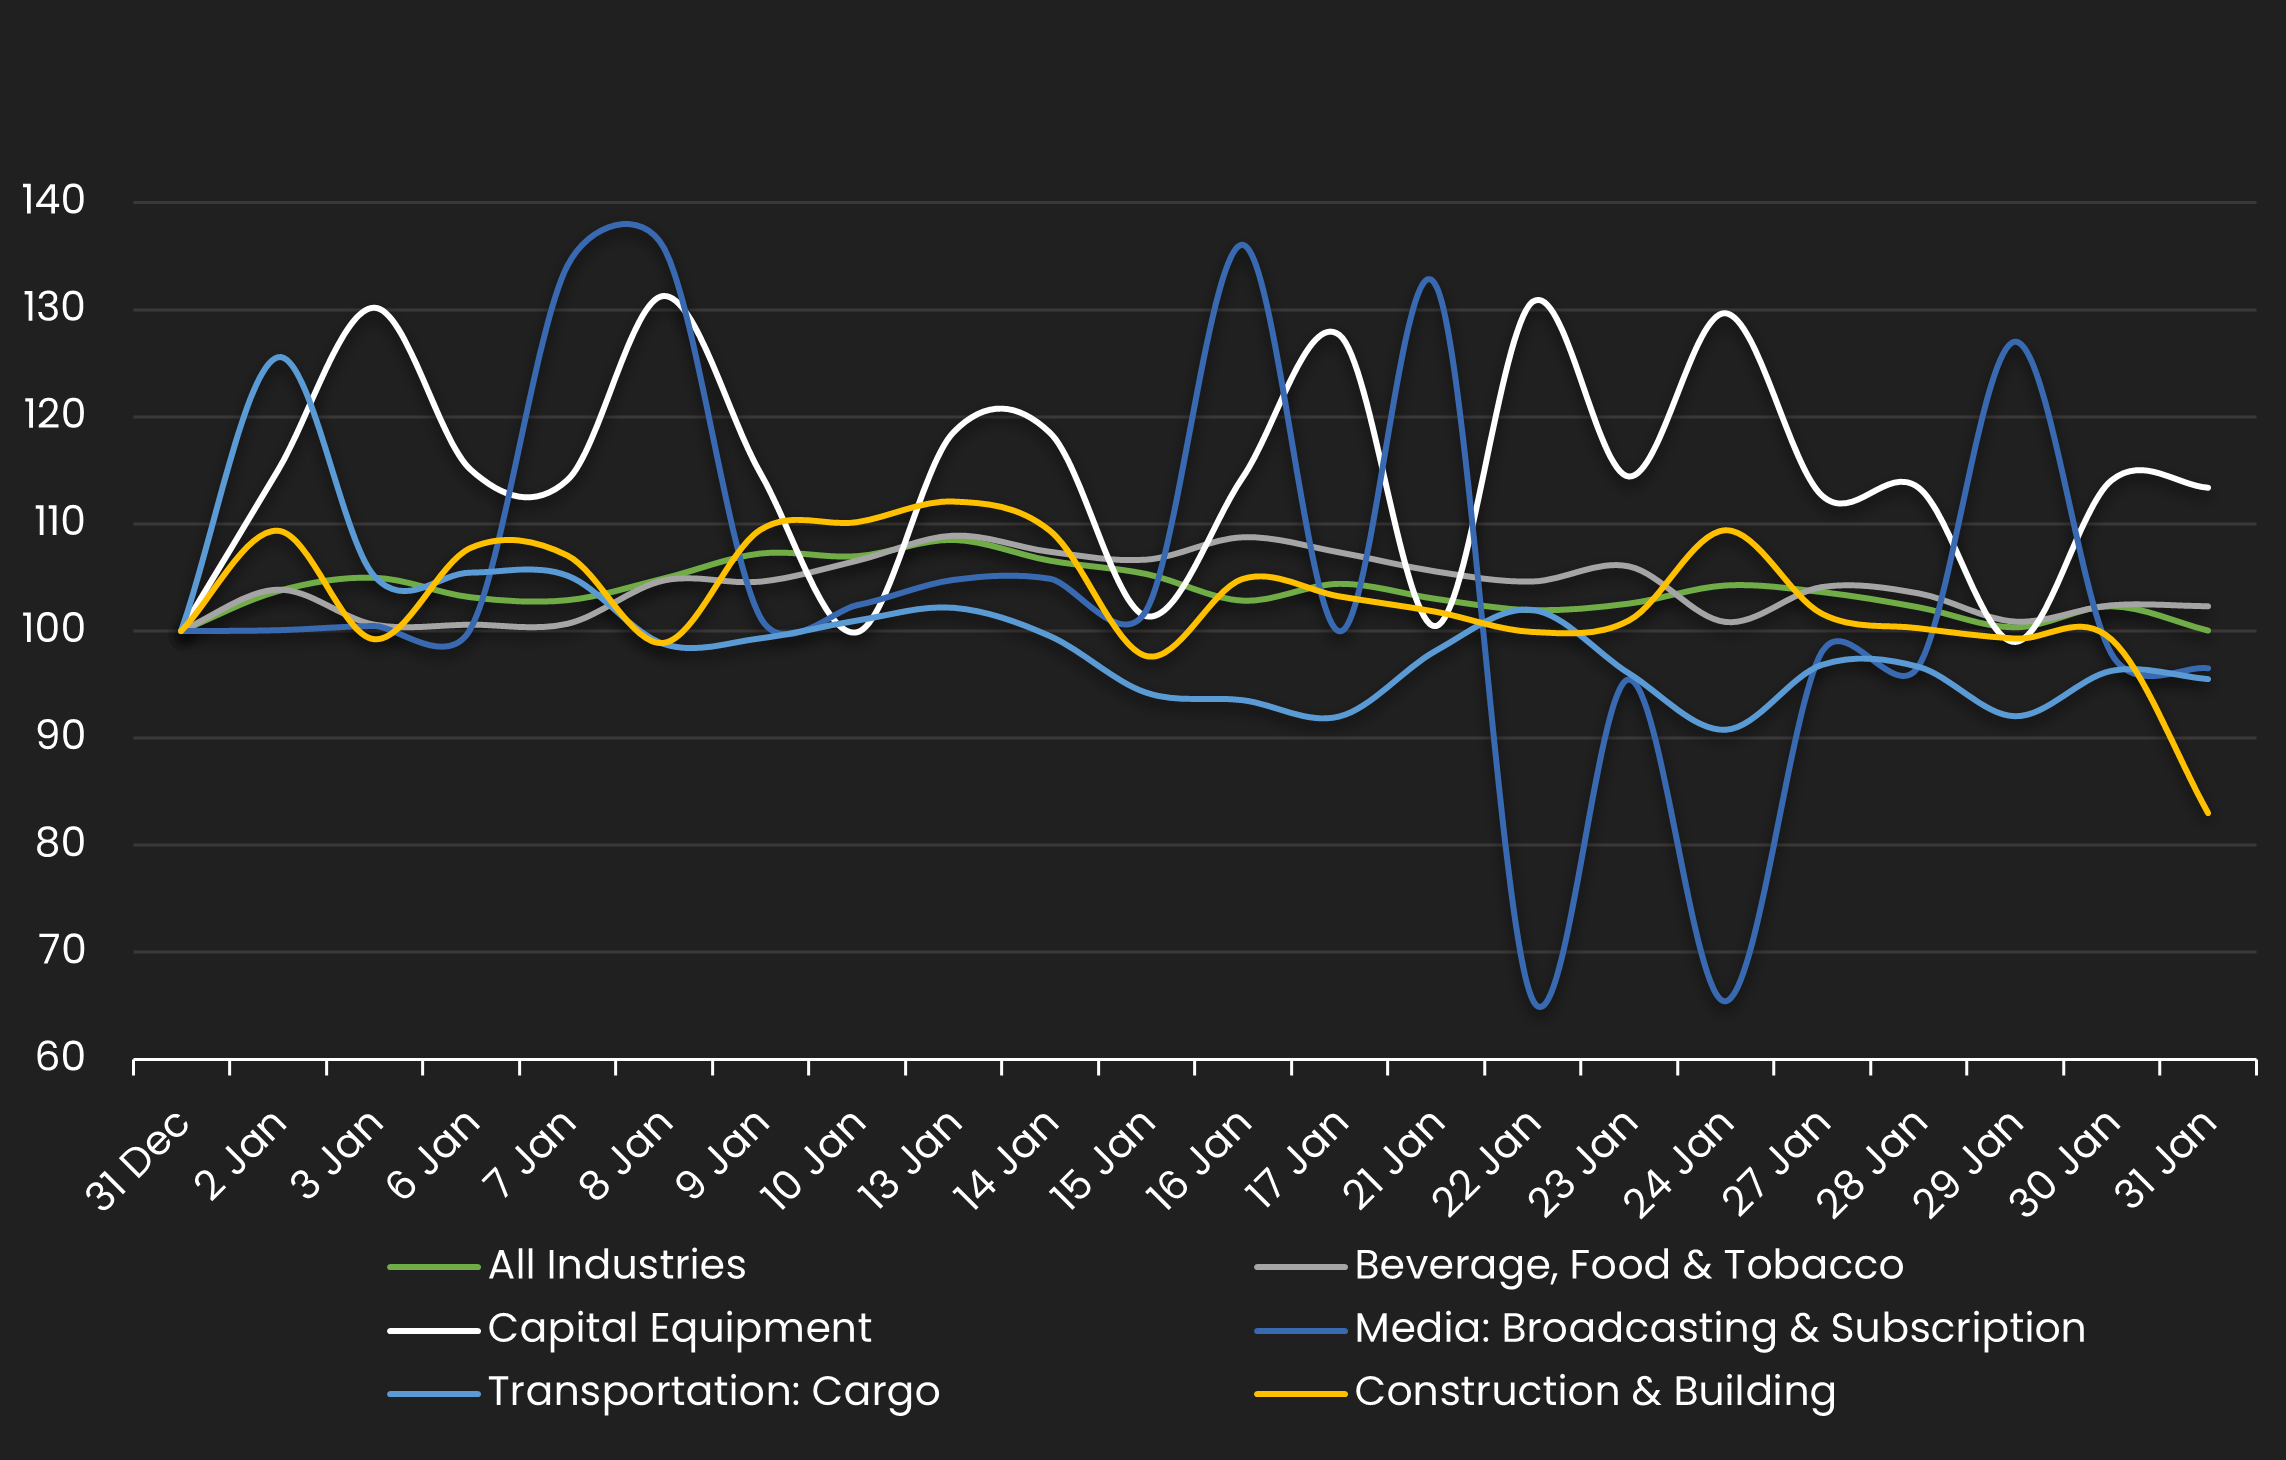
IG Spread by Industries – Monthly Comparison
Exhibits the IG spread by industry for the month ending 12/31/24 vs. the month ending 1/31/25
| INDUSTRIES | PREVIOUS SPREAD | CURRENT SPREAD | BPS CHANGE | MONTHLY PERFORMANCE | CDS COUNT |
|---|---|---|---|---|---|
| All Industries | 48 | 48 | 0 | Wider | 616 |
| Beverage, Food & Tobacco | 40 | 41 | 1 | Wider | 34 |
| Capital Equipment | 55 | 62 | 7 | Wider | 10 |
| Media: Broadcasting & Subscription | 82 | 80 | -3 | Tighter | 2 |
| Transportation: Cargo | 25 | 24 | -1 | Tighter | 12 |
| Construction & Building | 50 | 42 | -9 | Tighter | 18 |
Stay up-to-date with monthly summaries.
Related Resources
About SOLVE
SOLVE is the leading market data platform provider for fixed-income securities, trusted by sophisticated buy-side and sell-side firms worldwide. Founded in 2011, SOLVE leverages its AI-driven technology and deep industry expertise to offer unparalleled transparency into markets, reduce risk, and save hundreds of hours across front-office workflows. With the largest real-time datasets for Securitized Products, Municipal Bonds, Corporate Bonds, Syndicated Bank Loans, Convertible Bonds, CDS, and Private Credit, SOLVE empowers clients to transform the way they bring new securities to market, trade on secondary markets, and value highly illiquid securities. Headquartered in Connecticut, with offices across the globe, SOLVE is the definitive source for market pricing in fixed-income markets.
