Investment Grade CDS Market Summary – February 2025
GET OUR CDS MARKET SUMMARIES STRAIGHT TO YOUR INBOX. LEARN MORE
Investment Grade CDS Market February 2025
Our newsletter presents key trends derived from observable Credit Default Swaps pricing data over a monthly period.
Top 10 Outperformers
Showcases the top 10 IG CDS “outperformers” based on the largest mid spread decreases between 2/1/25 – 2/28/25
| RANK | BOND NAME | ISSUER | % CHANGE | BPS CHANGE | SPRD | SPRD-1 MONTH | DEALERS |
|---|---|---|---|---|---|---|---|
| 1 | BABA 5Y | ALIBABA GROUP HOLDING | -23.4% | -22 | 72 | 94 | 3 |
| 2 | TENCNT 5Y | TENCENT HLDGS LTD | -22.8% | -21 | 72 | 93 | 3 |
| 3 | APA 5Y | APACHE CORP | -21.3% | -16 | 60 | 76 | 3 |
| 4 | HAOHUA 5Y | CNAC CENTURY HK CO LTD | -19.0% | -18 | 77 | 95 | 3 |
| 5 | CNPCCH 5Y | CNPC HK OVERSEAS CAP LTD | -18.3% | -13 | 58 | 71 | 2 |
| 6 | POSCO 5Y | POSCO | -17.0% | -10 | 51 | 61 | 3 |
| 7 | INTC 5Y | INTEL | -16.2% | -12 | 61 | 73 | 6 |
| 8 | KAWKIS 5Y | KAWASAKI KISEN KAISHA LTD | -15.2% | -13 | 72 | 85 | 4 |
| 9 | AEGON 5Y | AEGON FDG CORP | -15.1% | -9 | 52 | 62 | 4 |
| 10 | CABKSM 5Y | CAIXABANK | -15.1% | -9 | 50 | 59 | 3 |
Top 10 Underperformers
Showcases the top 10 IG CDS “underperformers” based on the largest mid spread increases between 2/1/25 – 2/28/25
| RANK | BOND NAME | ISSUER | % CHANGE | BPS CHANGE | SPRD | SPRD-1 MONTH | DEALERS |
|---|---|---|---|---|---|---|---|
| 1 | CAPLSP 5Y | CAPITALAND LTD | 34.9% | 11 | 41 | 30 | 2 |
| 2 | WPPLN 5Y | GREY GLOBAL GROUP INC | 18.9% | 10 | 65 | 54 | 4 |
| 3 | MQB 5Y | MACQUARIE BANK LTD | 17.0% | 6 | 41 | 35 | 2 |
| 4 | XOM 5Y | EXXON SHIPPING CO | 14.8% | 5 | 39 | 34 | 3 |
| 5 | GLENLN 5Y | GLENCORE INTL PLC | 14.2% | 12 | 94 | 82 | 4 |
| 6 | DDS 5Y | DILLARD DEPT STORES INC | 14.0% | 11 | 92 | 81 | 3 |
| 7 | OPTUS 5Y | SINGAPORE TELECOMMUNICATIONS | 13.7% | 5 | 40 | 35 | 3 |
| 8 | FREGR 5Y | FRESENIUS SE & CO KGAA | 12.8% | 7 | 59 | 52 | 3 |
| 9 | TOL 5Y | TOLL BROS INC | 11.0% | 8 | 85 | 77 | 5 |
| 10 | CAG 5Y | CONAGRA FOODS INC | 10.5% | 5.5 | 58 | 53 | 7 |
Normalized IG Spread by Region
Displays the IG CDS spread by region between 2/1/25 – 2/28/25 Results are based on 5 select regions, however, we offer data across 12 regions
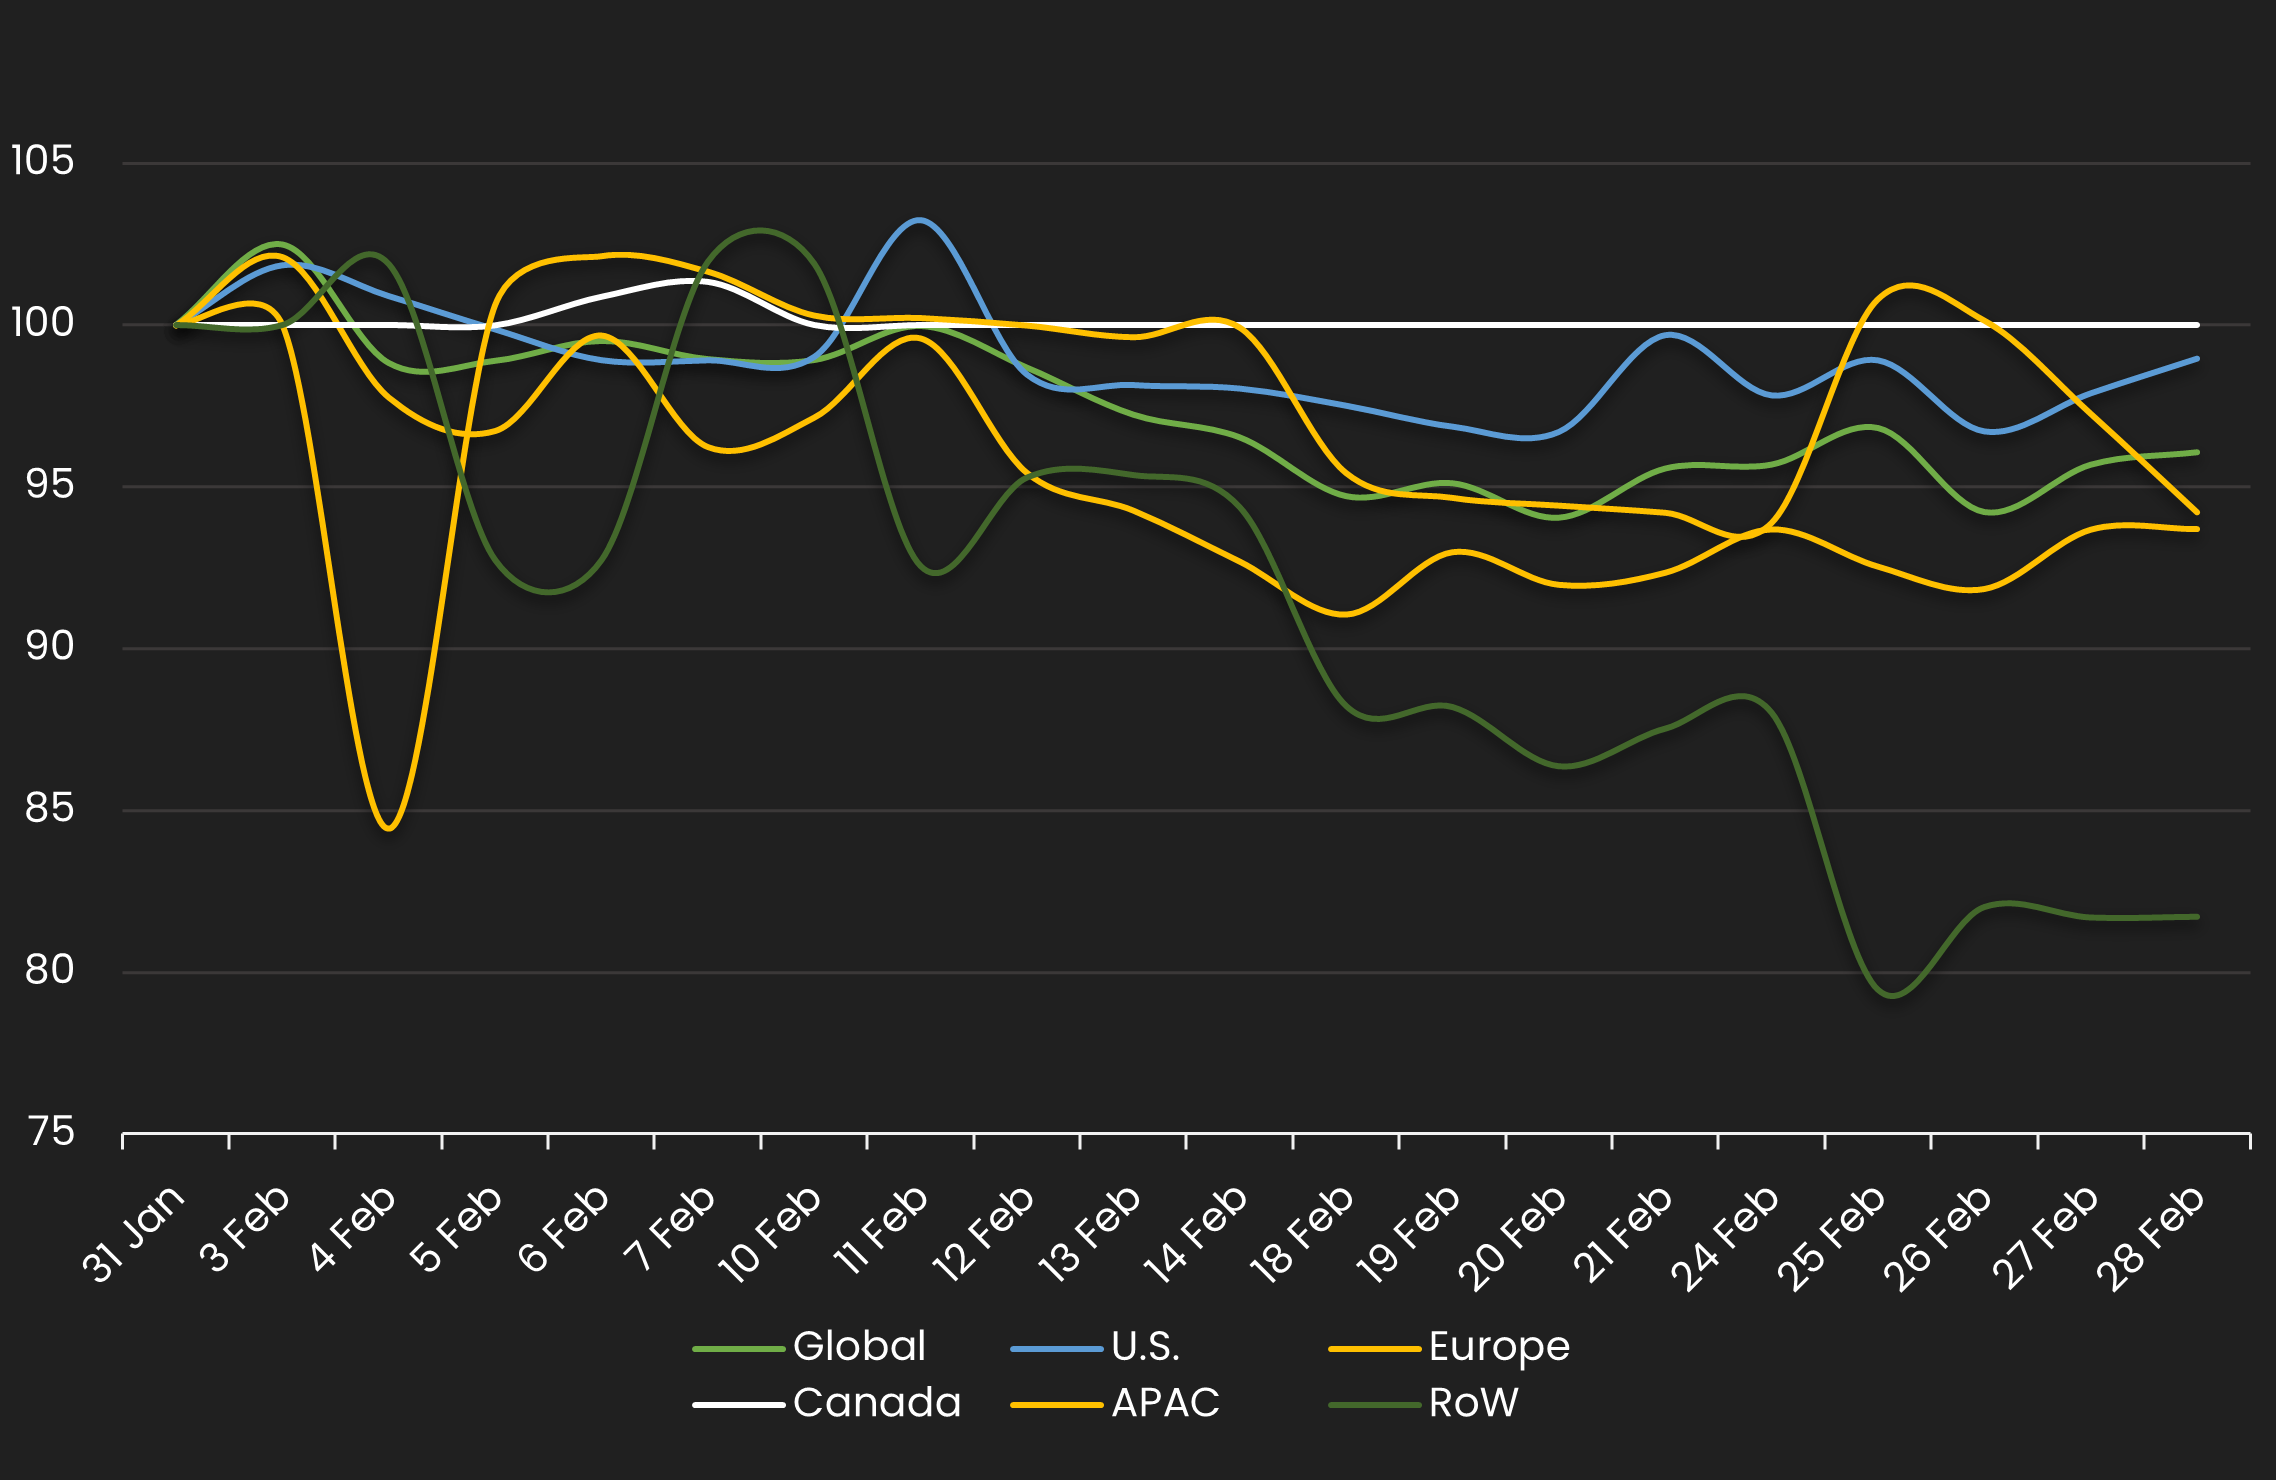
IG Spread by Region – Monthly Comparison
Exhibits the IG mid spread by region for the month ending 1/31/24 vs. the month ending 2/28/25
| REGION | PREVIOUS SPREAD | CURRENT SPREAD | BPS CHANGE | MONTHLY PERFORMANCE | CDS COUNT |
|---|---|---|---|---|---|
| Global | 48 | 46 | -2 | Tighter | 612 |
| U.S. | 46 | 46 | 0 | Tighter | 243 |
| Europe | 47 | 44 | -3 | Tighter | 156 |
| Canada | 47 | 47 | 0 | Unchanged | 15 |
| APAC | 52 | 49 | -3 | Tighter | 48 |
| RoW | 71 | 58 | -13 | Tighter | 11 |
Normalized IG Spread by Industry
Displays the IG CDS spread by industry between 2/1/25 – 2/28/25 Results are based on 5 select industry sectors, however, we offer data across 36 sectors
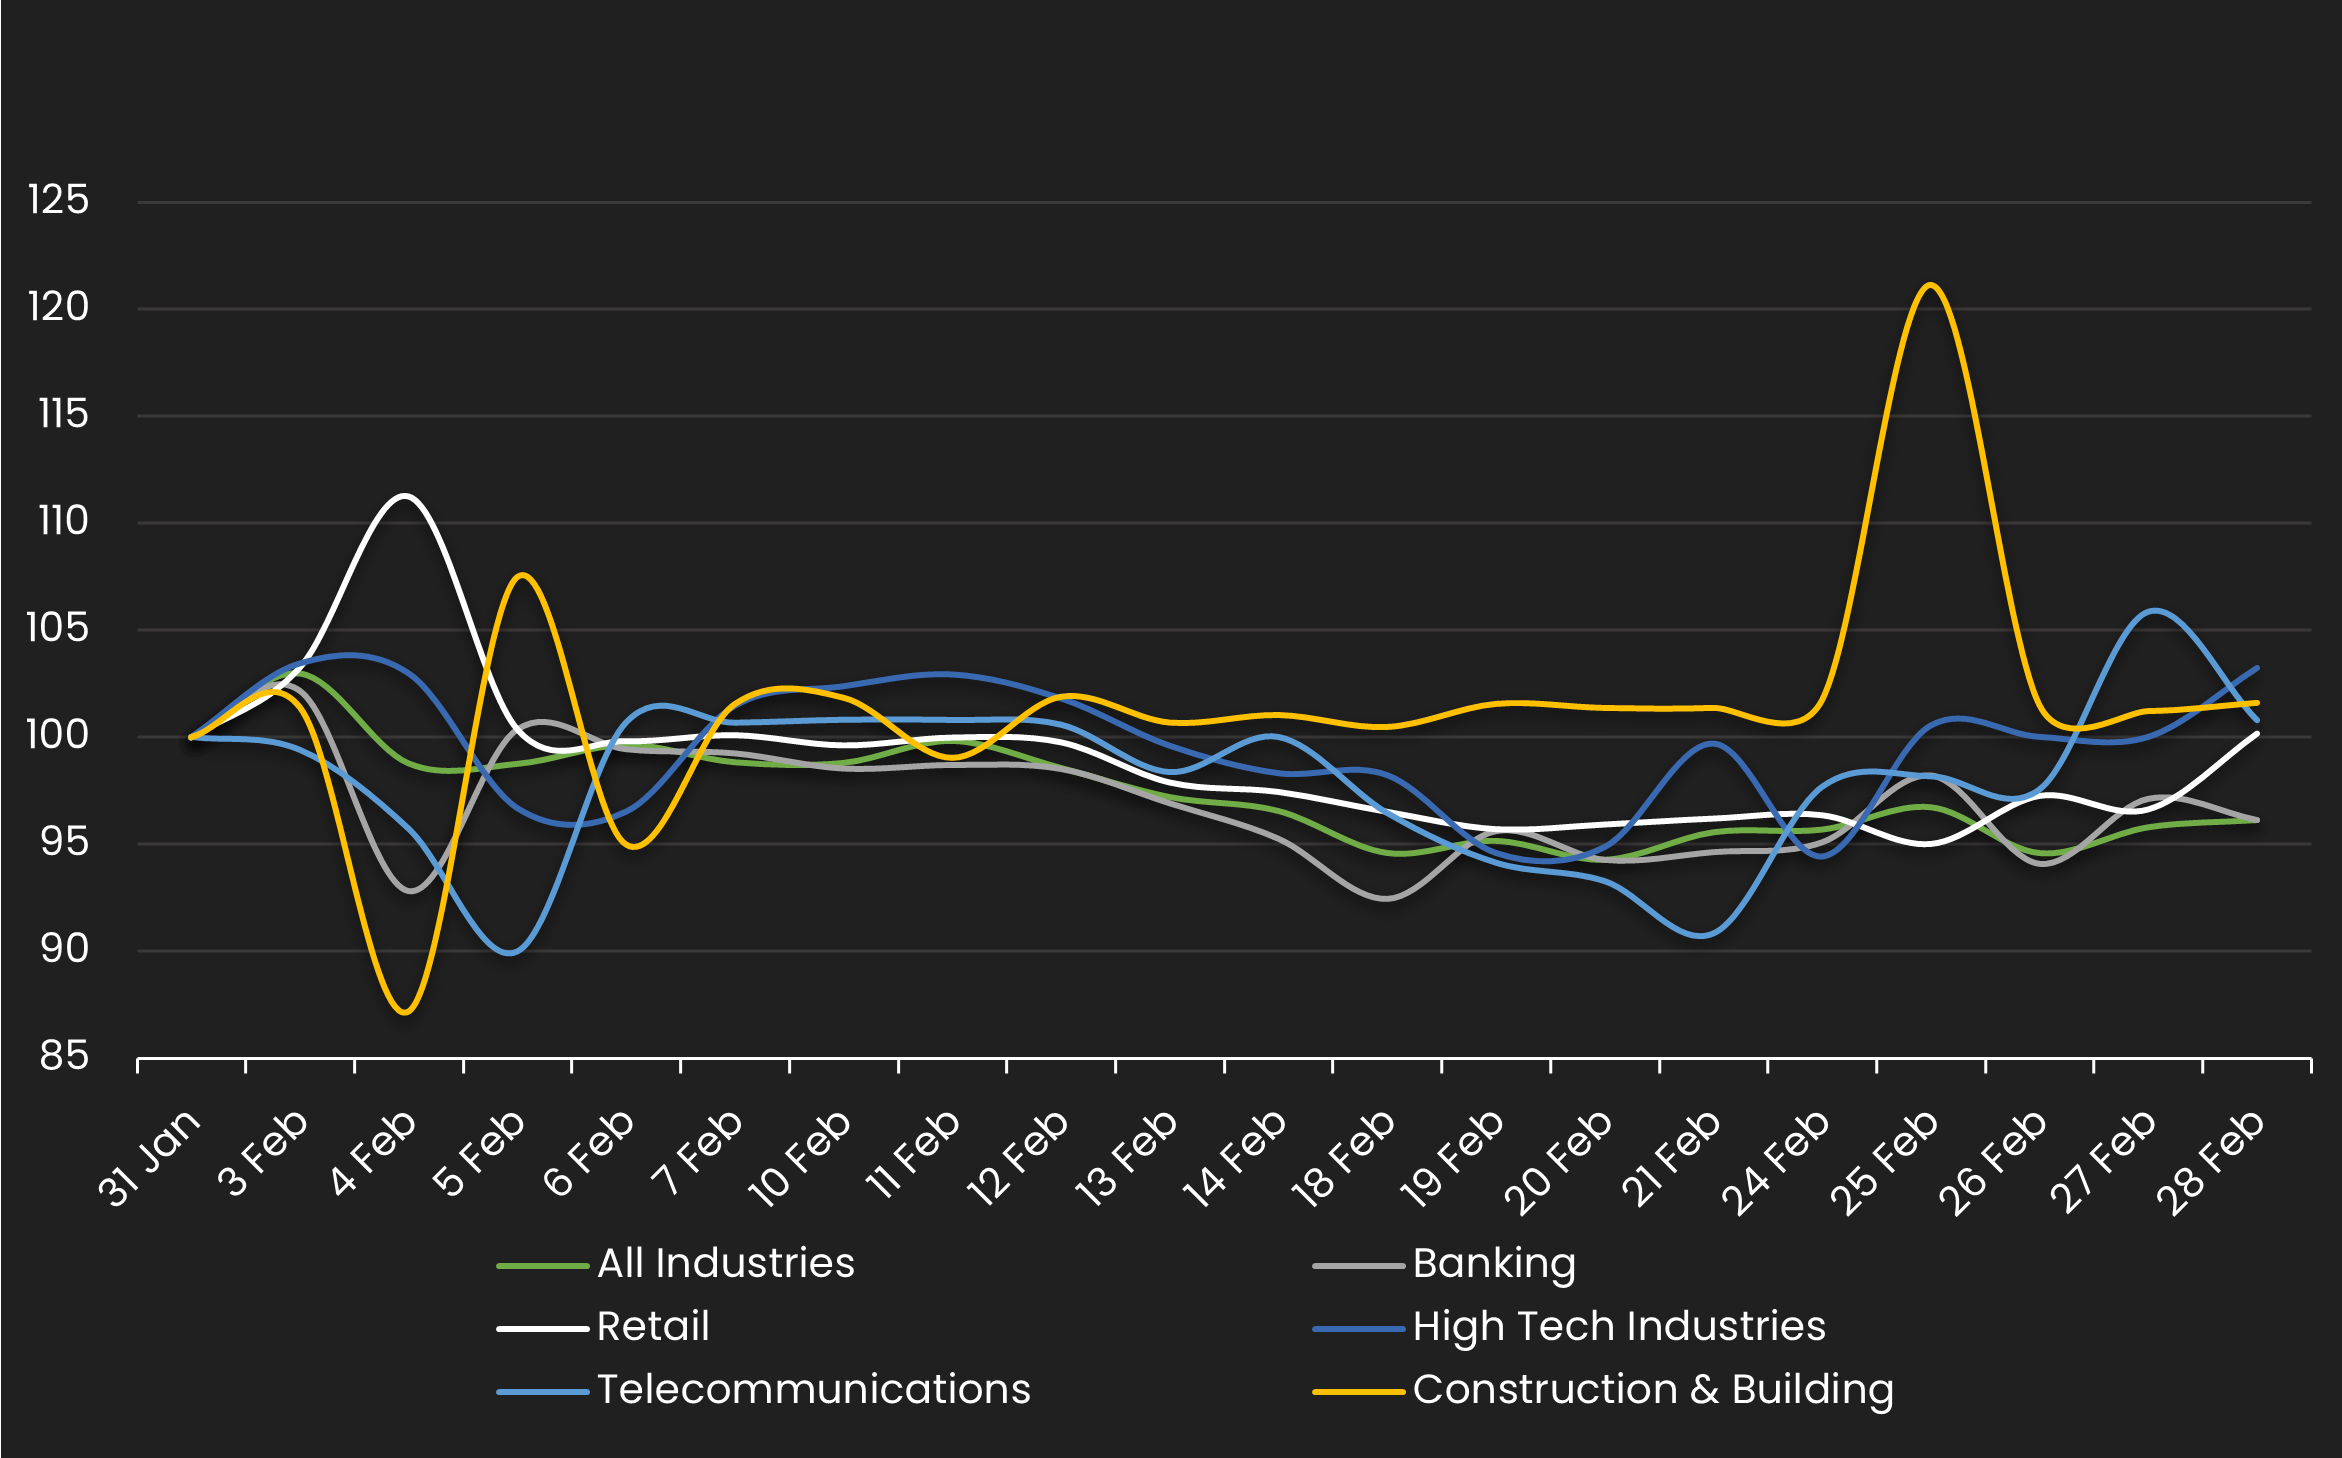
IG Spread by Industries – Monthly Comparison
Exhibits the IG spread by industry for the month ending 1/31/24 vs. the month ending 2/28/25
| INDUSTRIES | PREVIOUS SPREAD | CURRENT SPREAD | BPS CHANGE | MONTHLY PERFORMANCE | CDS COUNT |
|---|---|---|---|---|---|
| All Industries | 48 | 46 | -2 | Tighter | 614.00 |
| Banking | 47 | 46 | -2 | Tighter | 49.00 |
| Retail | 38 | 38 | 0 | Wider | 21.00 |
| High Tech Industries | 35 | 36 | 1 | Wider | 27.00 |
| Telecommunications | 41 | 42 | 0 | Wider | 32.00 |
| Construction & Building | 42 | 43 | 1 | Wider | 18.00 |
Stay up-to-date with monthly summaries.
Related Resources
About SOLVE
SOLVE is the leading market data platform provider for fixed-income securities, trusted by sophisticated buy-side and sell-side firms worldwide. Founded in 2011, SOLVE leverages its AI-driven technology and deep industry expertise to offer unparalleled transparency into markets, reduce risk, and save hundreds of hours across front-office workflows. With the largest real-time datasets for Securitized Products, Municipal Bonds, Corporate Bonds, Syndicated Bank Loans, Convertible Bonds, CDS, and Private Credit, SOLVE empowers clients to transform the way they bring new securities to market, trade on secondary markets, and value highly illiquid securities. Headquartered in Connecticut, with offices across the globe, SOLVE is the definitive source for market pricing in fixed-income markets.
