Investment Grade CDS Market Summary – February 2024
GET OUR CDS MARKET SUMMARIES STRAIGHT TO YOUR INBOX. LEARN MORE
Investment Grade CDS Market Summary: february 2024
Our newsletter presents key trends derived from observable Credit Default Swaps pricing data over a monthly period.
Top 10 Outperformers
Showcases the top 10 IG CDS “outperformers” based on the largest mid spread decreases between 2/1/24 – 2/29/24
| RANK | BOND NAME | ISSUER | % CHANGE | BPS CHANGE | SPRD | SPRD-1 MONTH | DEALERS |
|---|---|---|---|---|---|---|---|
| 1 | OPTUS 5Y | SINGAPORE TELECOMMUNICATIONS | -28.8% | -15 | 37 | 52 | 4 |
| 2 | LUV 5Y | AIRTRAN HLDGS INC | -22.9% | -20 | 67 | 88 | 5 |
| 3 | BASGR 5Y | ENGELHARD CORP | -22.2% | -11 | 40 | 52 | 5 |
| 4 | DELL 5Y | DELL COMPUTER CORP | -18.7% | -12 | 53 | 66 | 6 |
| 5 | HYUELE 5Y | HYNIX SEMICONDUCTOR INC | -18.6% | -16 | 70 | 86 | 2 |
| 6 | ALTRIA 5Y | ALTRIA GROUP INC | -18.6% | -10 | 44 | 54 | 5 |
| 7 | ORCL 5Y | ORACLE CORP | -17.5% | -9 | 43 | 52 | 6 |
| 8 | MWDP 5Y | WENDEL | -17.3% | -14 | 66 | 80 | 5 |
| 9 | HEIGR 5Y | STARDUST FINANCE HOLDINGS INC | -16.8% | -16 | 77 | 93 | 3 |
| 10 | KOBSTL 5Y | KOBE STEEL LTD | -16.7% | -11 | 56 | 67 | 3 |
Top 10 Underperformers
Showcases the top 10 IG CDS “underperformers” based on the largest mid spread increases between 2/1/24 – 2/29/24
| RANK | BOND NAME | ISSUER | % CHANGE | BPS CHANGE | SPRD | SPRD-1 MONTH | DEALERS |
|---|---|---|---|---|---|---|---|
| 1 | UUW 5Y | UNITED UTILS PLC | 11.4% | 5 | 53 | 48 | 6 |
| 2 | BWA 5Y | BORGWARNER INC | 10.0% | 7 | 78 | 71 | 4 |
| 3 | NKE 5Y | NIKE INC MEDIUM TERM NTS BOOK | 9.8% | 6 | 65 | 59 | 2 |
| 4 | CI 5Y | CIGNA CORP | 8.1% | 4 | 53 | 49 | 3 |
| 5 | ENGIFP 5Y | GDF SUEZ | 7.7% | 3 | 39 | 36 | 6 |
| 6 | HRB 5Y | BLOCK FINL LLC | 7.0% | 4 | 64 | 60 | 6 |
| 7 | NEM 5Y | NEWMONT MNG CORP | 6.8% | 3 | 45 | 42 | 6 |
| 8 | ADECCO 5Y | ADECCO SA | 6.8% | 5 | 79 | 74 | 6 |
| 9 | ENIIM 5Y | ENI SPA | 5.0% | 3 | 53 | 50 | 6 |
| 10 | SGOFP 5Y | CIE DE SAINT-GOBAIN | 4.5% | 2.0 | 45 | 43 | 6 |
Normalized IG Spread by Region
Displays the IG CDS spread by region between 2/1/24 – 2/29/24 Results are based on 5 select regions, however, we offer data across 12 regions
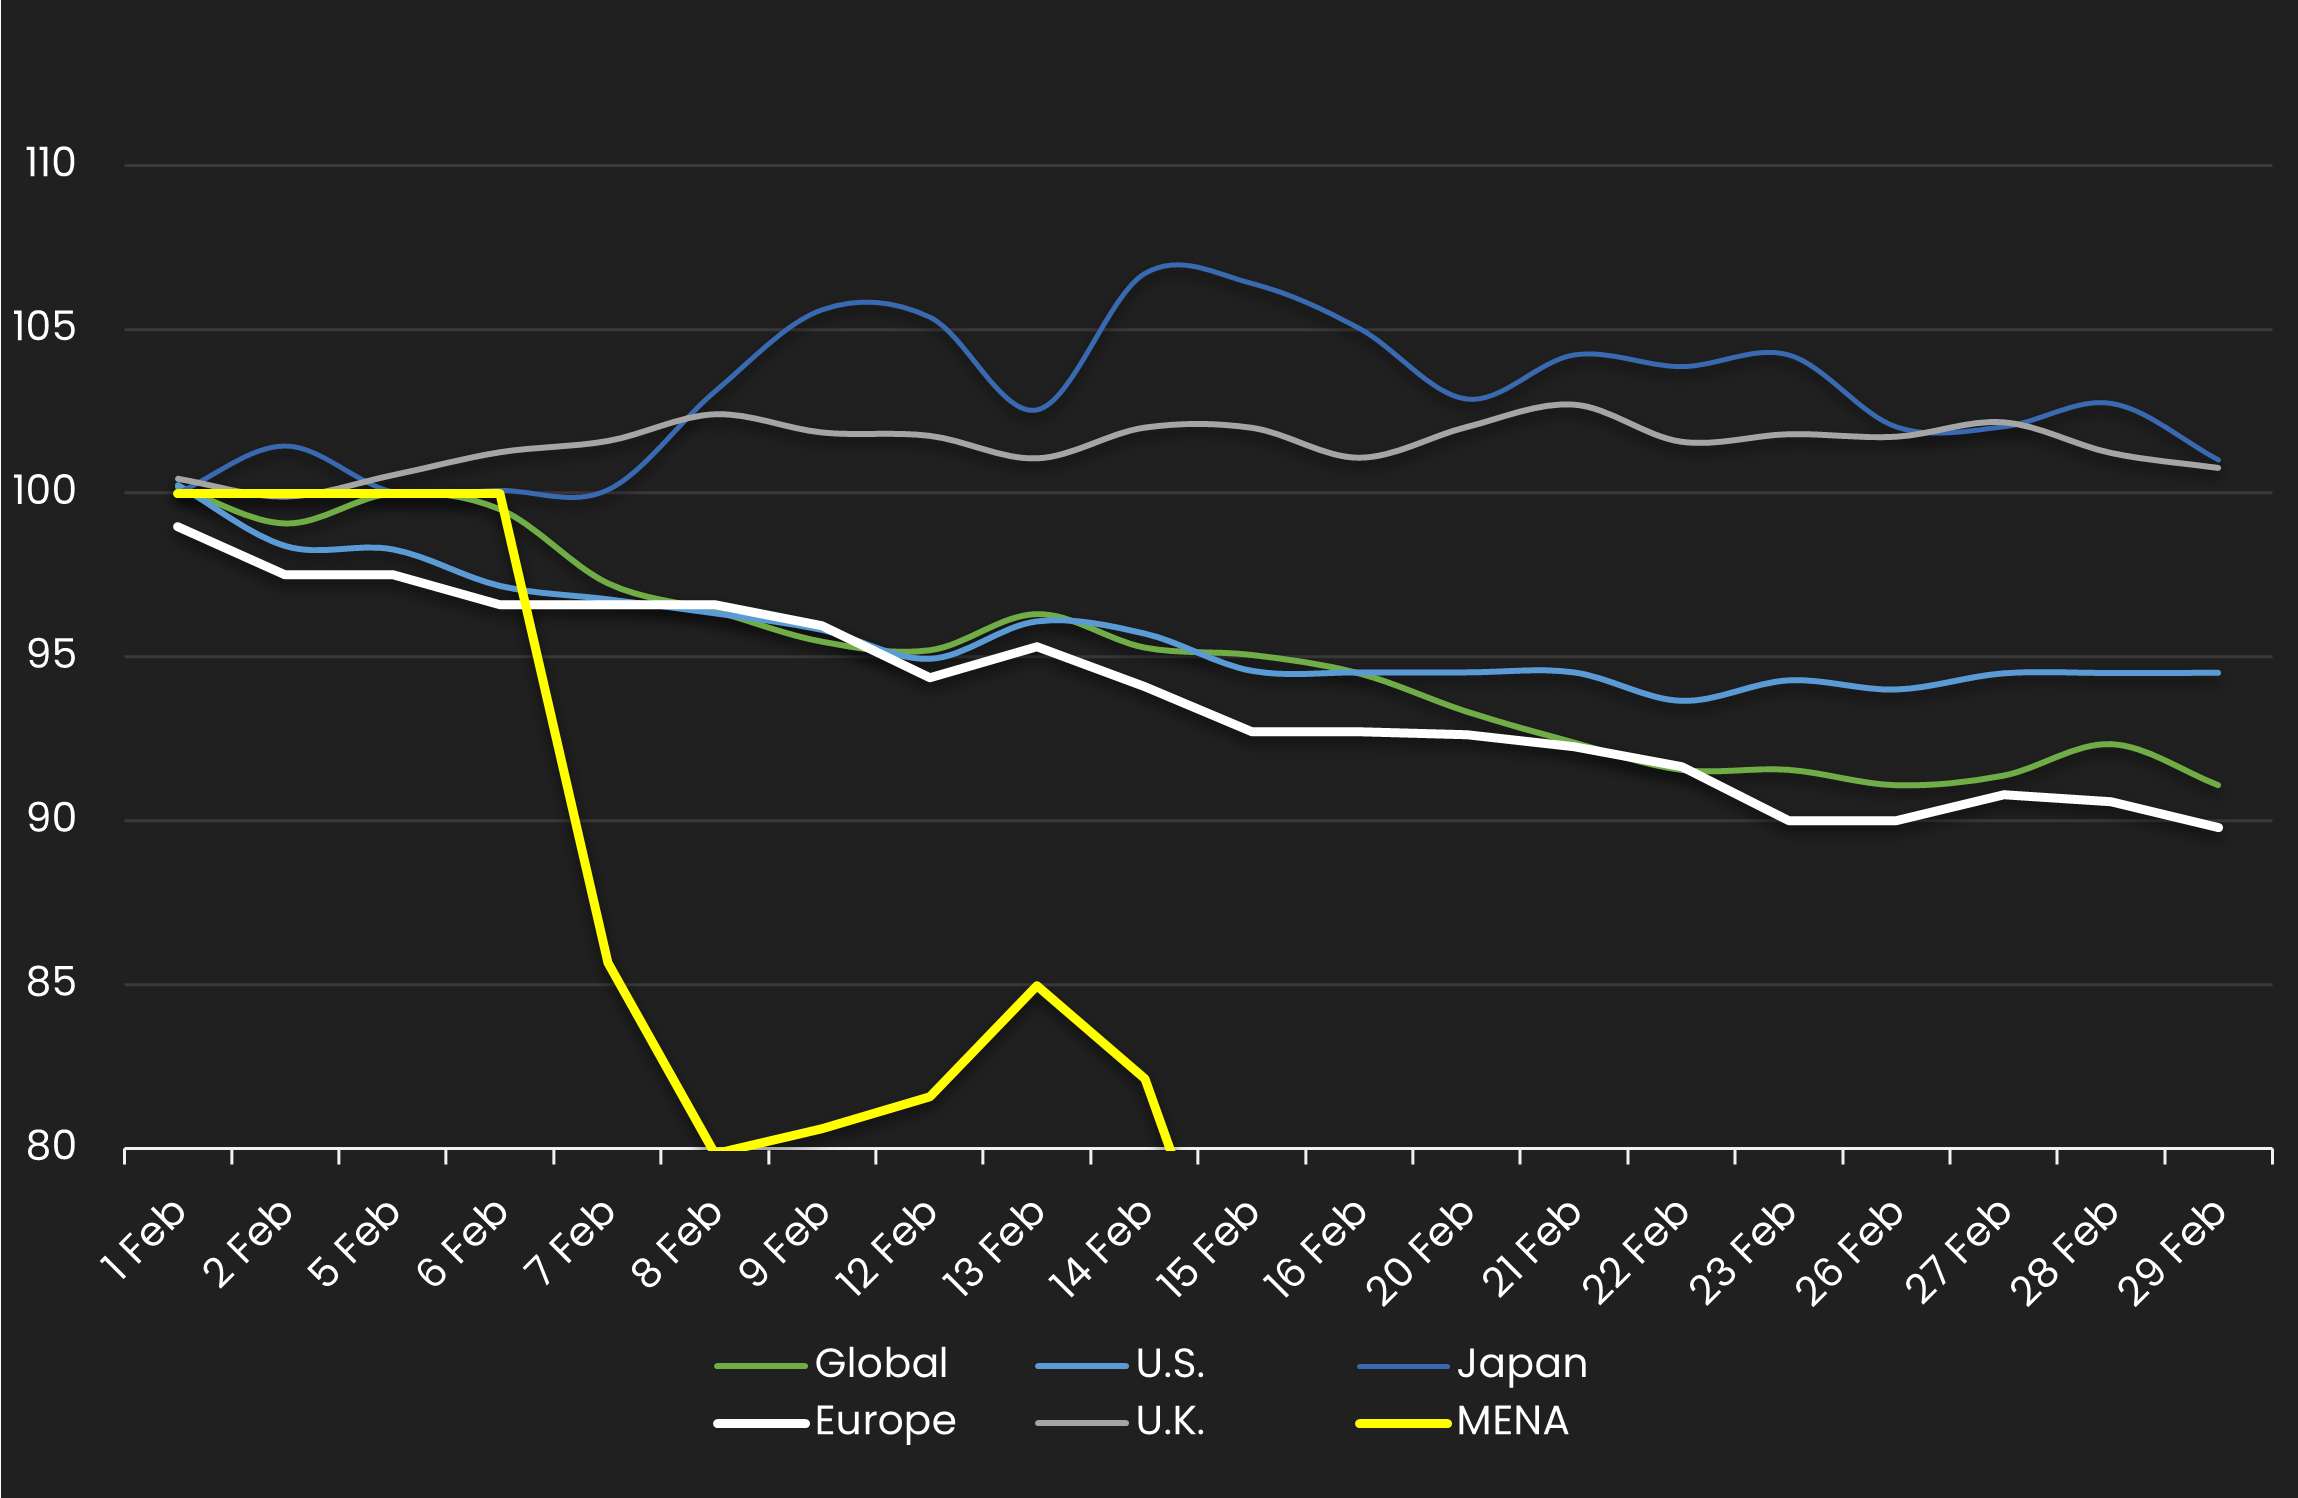
IG Spread by Region – Monthly Comparison
Exhibits the IG mid spread by region for the month ending 1/31/23 vs. the month ending 2/29/24
| REGION | PREVIOUS SPREAD | CURRENT SPREAD | BPS CHANGE | MONTHLY PERFORMANCE | CDS COUNT |
|---|---|---|---|---|---|
| Global | 54 | 49 | -5 | Tighter | 578 |
| U.S. | 53 | 50 | -3 | Tighter | 236 |
| Japan | 30 | 30 | 0 | Wider | 43 |
| Europe | 52 | 46 | -5 | Tighter | 152 |
| U.K. | 58 | 58 | 0 | Wider | 39 |
| MENA | 81 | 57 | -24 | Tighter | 10 |
Normalized IG Spread by Industry
Displays the IG CDS spread by industry between 2/1/24 – 2/29/24 Results are based on 5 select industry sectors, however, we offer data across 36 sectors
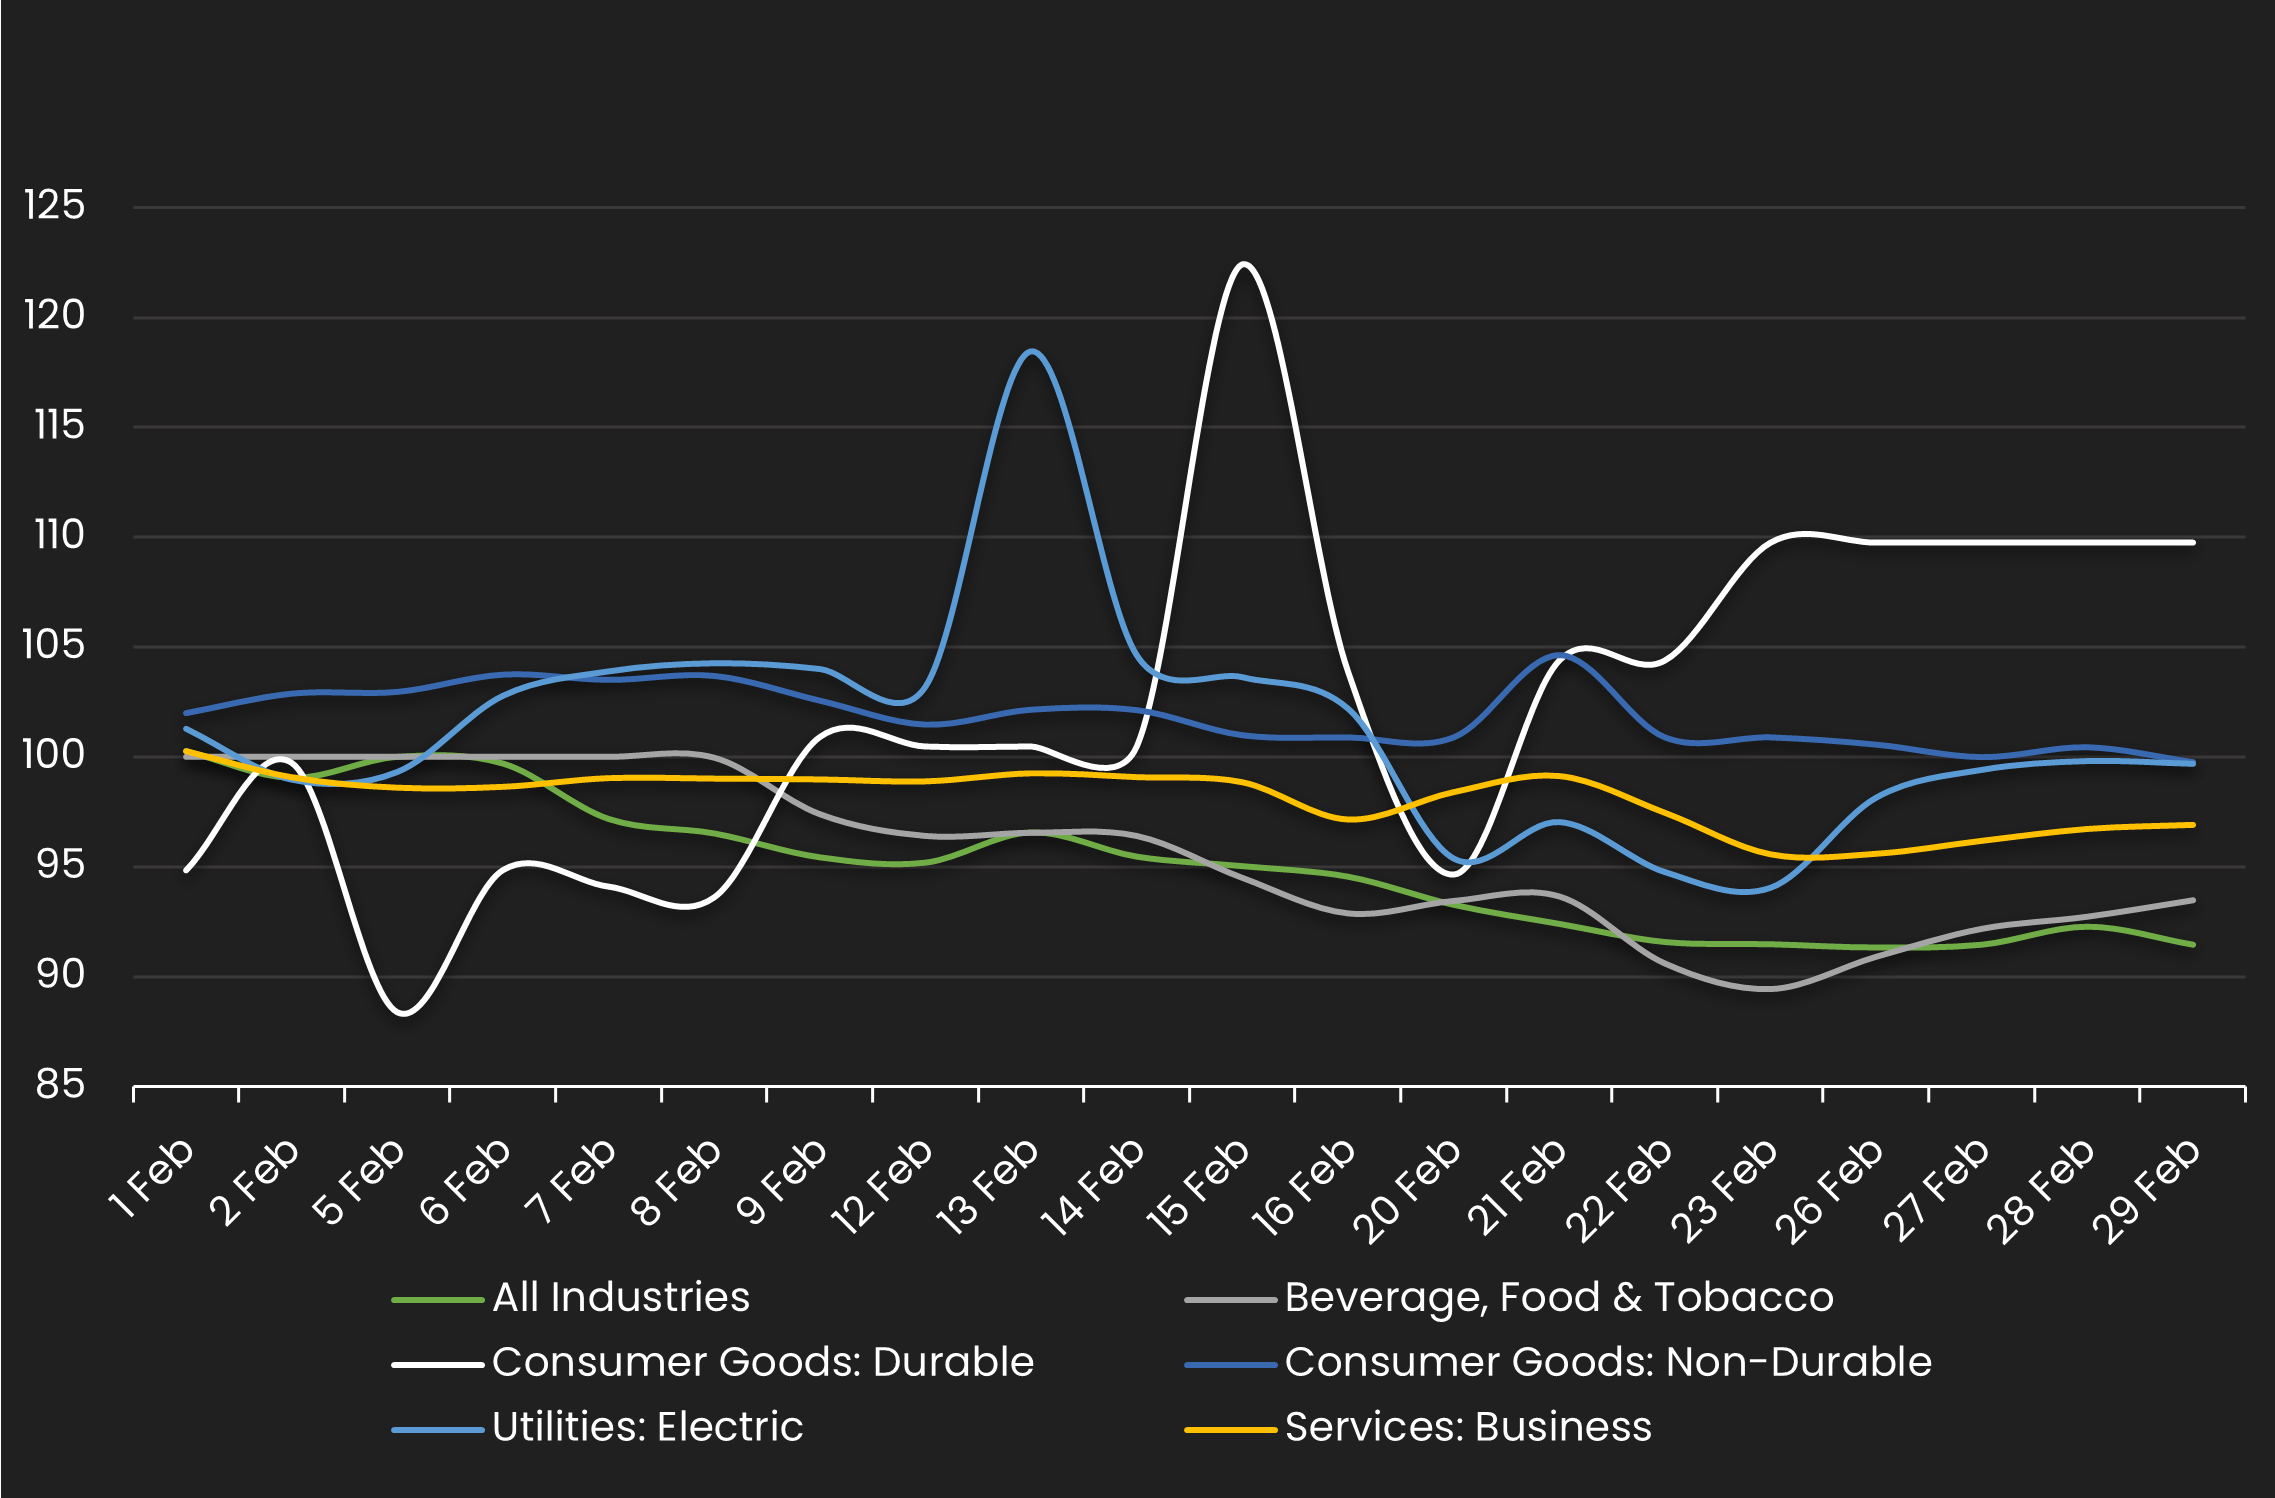
IG Spread by Industries – Monthly Comparison
Exhibits the IG spread by industry for the month ending 1/31/23 vs. the month ending 2/29/24
| INDUSTRIES | PREVIOUS SPREAD | CURRENT SPREAD | BPS CHANGE | MONTHLY PERFORMANCE | CDS COUNT |
|---|---|---|---|---|---|
| All Industries | 54 | 49 | -5 | Tighter | 579.00 |
| Beverage, Food & Tobacco | 43 | 40 | -3 | Tighter | 32.00 |
| Consumer Goods: Durable | 59 | 65 | 6 | Wider | 7.00 |
| Consumer Goods: Non-Durable | 54 | 53 | 0 | Tighter | 13.00 |
| Utilities: Electric | 46 | 46 | 0 | Tighter | 24.00 |
| Services: Business | 57 | 55 | -2 | Tighter | 3.00 |
Stay up-to-date with monthly summaries.
Related Resources
About SOLVE
SOLVE is the leading market data platform provider for fixed-income securities, trusted by sophisticated buy-side and sell-side firms worldwide. Founded in 2011, SOLVE leverages its AI-driven technology and deep industry expertise to offer unparalleled transparency into markets, reduce risk, and save hundreds of hours across front-office workflows. With the largest real-time datasets for Securitized Products, Municipal Bonds, Corporate Bonds, Syndicated Bank Loans, Convertible Bonds, CDS, and Private Credit, SOLVE empowers clients to transform the way they bring new securities to market, trade on secondary markets, and value highly illiquid securities. Headquartered in Connecticut, with offices across the globe, SOLVE is the definitive source for market pricing in fixed-income markets.
