Investment Grade CDS Market Summary – December 2024
GET OUR CDS MARKET SUMMARIES STRAIGHT TO YOUR INBOX. LEARN MORE
Investment Grade CDS Market december 2024
Our newsletter presents key trends derived from observable Credit Default Swaps pricing data over a monthly period.
Top 10 Outperformers
Showcases the top 10 IG CDS “outperformers” based on the largest mid spread decreases between 12/1/24 – 12/31/24
| RANK | BOND NAME | ISSUER | % CHANGE | BPS CHANGE | SPRD | SPRD-1 MONTH | DEALERS |
|---|---|---|---|---|---|---|---|
| 1 | APA 5Y | APACHE CORP | -23.4% | -26 | 87 | 113 | 3 |
| 2 | RCICN 5Y | ROGERS CABLE INC | -20.9% | -22 | 85 | 108 | 2 |
| 3 | ITVLN 5Y | ITV PLC | -13.2% | -14 | 94 | 108 | 3 |
| 4 | VIVFP 5Y | SEAGRAM CO LTD | -9.1% | -9 | 86 | 94 | 3 |
| 5 | CNHIIM 5Y | FIAT INDUSTRIAL SPA | -6.8% | -7 | 90 | 96 | 3 |
| 6 | TCKCN 5Y | TECK RESOURCES LIMITED | -6.4% | -5 | 73 | 78 | 3 |
| 7 | CONTI 5Y | CONTI-GUMMI FIN B V | -5.9% | -5 | 85 | 91 | 4 |
| 8 | HOTGR 5Y | HOCHTIEF AG | -5.5% | -4 | 70 | 74 | 4 |
| 9 | LLOYDS HOLDCO 5Y | BANK OF SCOTLAND PLC | -5.1% | -3 | 60 | 63 | 4 |
| 10 | RIOLN 5Y | ALCAN INC | -5.1% | -3 | 58 | 61 | 3 |
Top 10 Underperformers
Showcases the top 10 IG CDS “underperformers” based on the largest mid spread increases between 12/1/24 – 12/31/24
| RANK | BOND NAME | ISSUER | % CHANGE | BPS CHANGE | SPRD | SPRD-1 MONTH | DEALERS |
|---|---|---|---|---|---|---|---|
| 1 | CVS 5Y | CVS CAREMARK CORP | 35.8% | 23 | 88 | 65 | 3 |
| 2 | TOL 5Y | TOLL BROS INC | 25.4% | 16 | 80 | 63 | 3 |
| 3 | FREGR 5Y | FRESENIUS SE & CO KGAA | 24.7% | 11 | 57 | 45 | 3 |
| 4 | PHM 5Y | CENTEX CORP | 23.8% | 15 | 79 | 63 | 3 |
| 5 | LEN 5Y | LENNAR CORP | 23.5% | 15 | 79 | 64 | 3 |
| 6 | ACOMCO 5Y | ACOM CO LTD | 20.1% | 9 | 52 | 43 | 3 |
| 7 | KFT 5Y | CADBURY SCHWEPPES US FINANCE | 19.1% | 6 | 38 | 32 | 3 |
| 8 | INTC 5Y | INTEL | 18.8% | 14 | 89 | 75 | 3 |
| 9 | UNH 5Y | PACIFICARE HEALTH SYS INC DEL | 18.4% | 7 | 44 | 37 | 3 |
| 10 | ABIBB 5Y | ANHEUSER BUSCH INBEV WORLDWIDE | 17.8% | 6.1 | 40 | 34 | 6 |
Normalized IG Spread by Region
Displays the IG CDS spread by region between 12/1/24 – 12/31/24 Results are based on 5 select regions, however, we offer data across 12 regions
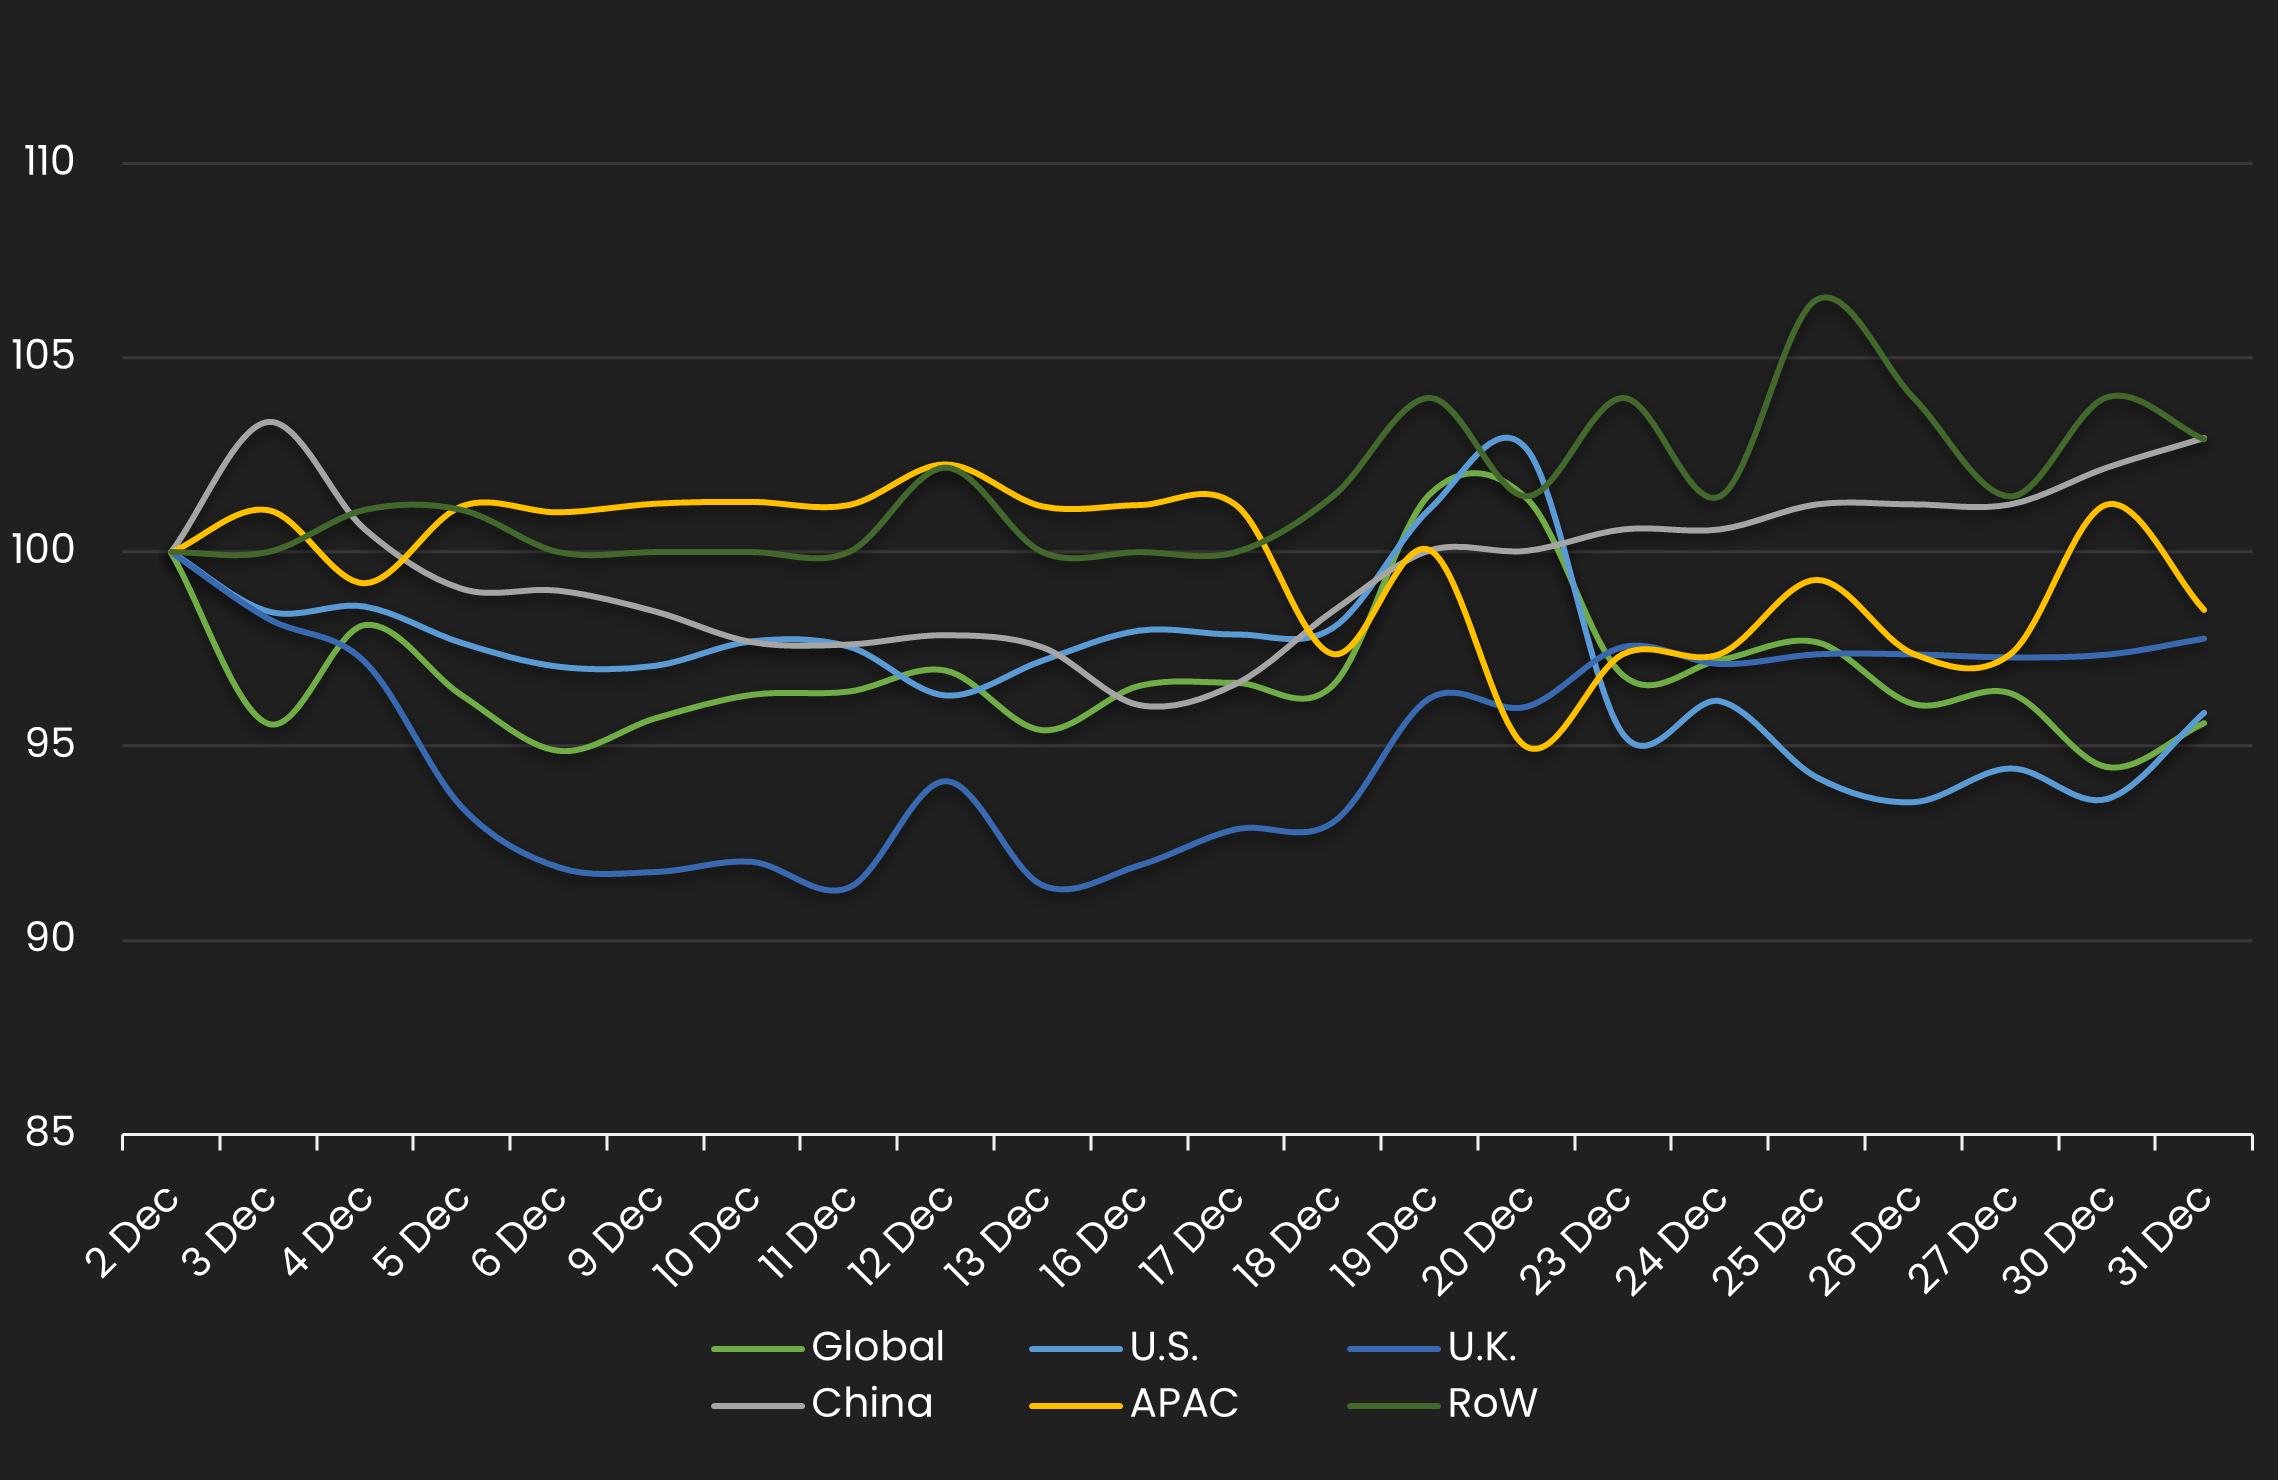
IG Spread by Region – Monthly Comparison
Exhibits the IG mid spread by region for the month ending 11/30/23 vs. the month ending 12/31/24
| REGION | PREVIOUS SPREAD | CURRENT SPREAD | BPS CHANGE | MONTHLY PERFORMANCE | CDS COUNT |
|---|---|---|---|---|---|
| Global | 49 | 47 | -2 | Tighter | 541 |
| U.S. | 46 | 44 | -2 | Tighter | 207 |
| U.K. | 55 | 53 | -1 | Tighter | 41 |
| China | 64 | 66 | 2 | Wider | 9 |
| APAC | 51 | 51 | -1 | Tighter | 42 |
| RoW | 69 | 71 | 2 | Wider | 11 |
Normalized IG Spread by Industry
Displays the IG CDS spread by industry between 12/1/24 – 12/31/24 Results are based on 5 select industry sectors, however, we offer data across 36 sectors
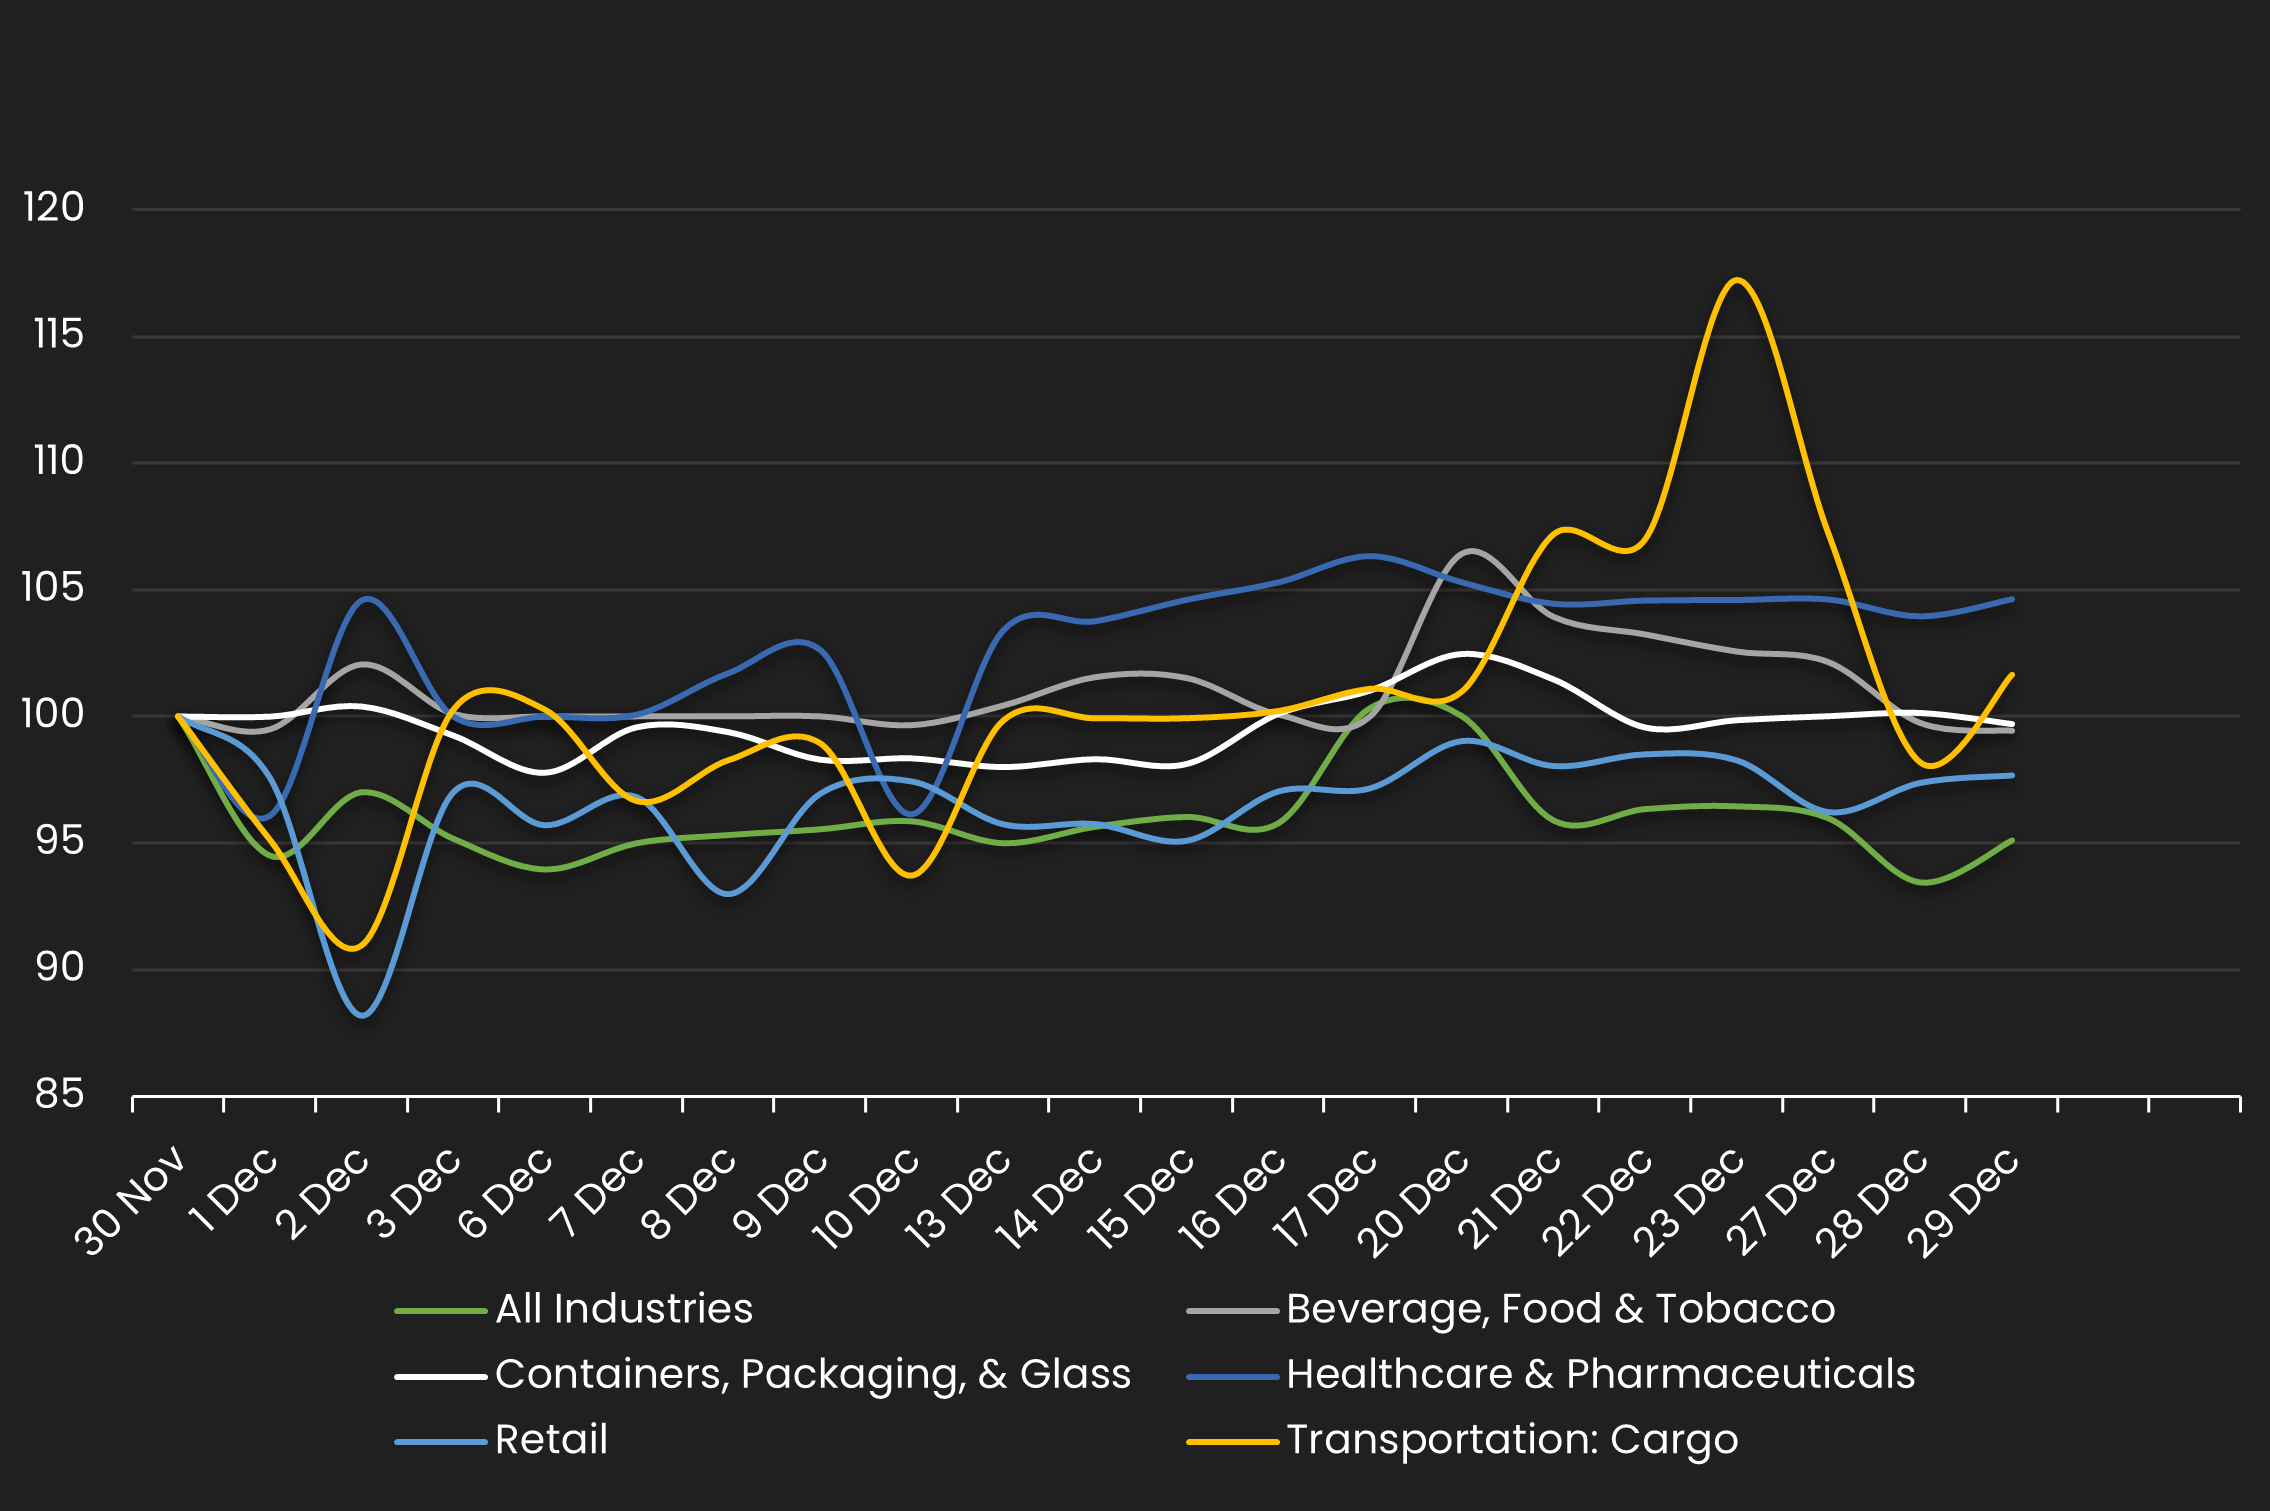
IG Spread by Industries – Monthly Comparison
Exhibits the IG spread by industry for the month ending 11/30/23 vs. the month ending 12/31/24
| INDUSTRIES | PREVIOUS SPREAD | CURRENT SPREAD | BPS CHANGE | MONTHLY PERFORMANCE | CDS COUNT |
|---|---|---|---|---|---|
| All Industries | 50 | 48 | -2 | Tighter | 0 |
| Beverage, Food & Tobacco | 41 | 40 | 0 | Tighter | 0 |
| Containers, Packaging, & Glass | 25 | 25 | 0 | Tighter | 0 |
| Healthcare & Pharmaceuticals | 38 | 40 | 2 | Wider | 0 |
| Retail | 41 | 40 | -1 | Tighter | 0 |
| Transportation: Cargo | 25 | 25 | 0 | Wider | 0 |
Stay up-to-date with monthly summaries.
Related Resources
About SOLVE
SOLVE is the leading market data platform provider for fixed-income securities, trusted by sophisticated buy-side and sell-side firms worldwide. Founded in 2011, SOLVE leverages its AI-driven technology and deep industry expertise to offer unparalleled transparency into markets, reduce risk, and save hundreds of hours across front-office workflows. With the largest real-time datasets for Securitized Products, Municipal Bonds, Corporate Bonds, Syndicated Bank Loans, Convertible Bonds, CDS, and Private Credit, SOLVE empowers clients to transform the way they bring new securities to market, trade on secondary markets, and value highly illiquid securities. Headquartered in Connecticut, with offices across the globe, SOLVE is the definitive source for market pricing in fixed-income markets.
