Investment Grade CDS Market Summary – August 2023
GET OUR CDS MARKET SUMMARIES STRAIGHT TO YOUR INBOX. LEARN MORE
Investment Grade CDS Market Summary:August 2023
Our newsletter presents key trends derived from observable Credit Default Swaps pricing data over a monthly period.
Top 10 Outperformers
Showcases the top 10 IG CDS “outperformers” based on the largest mid spread decreases between 8/1/23 – 8/31/23
| RANK | BOND NAME | ISSUER | % CHANGE | BPS CHANGE | SPRD | SPRD-1 MONTH | DEALERS |
|---|---|---|---|---|---|---|---|
| 1 | ADECCO 5Y | ADECCO SA | -19.4% | -17 | 69 | 85 | 5 |
| 2 | NRUC 5Y | NATIONAL RURAL UTILS COOP FIN | -18.5% | -5 | 24 | 29 | 4 |
| 3 | HRB 5Y | BLOCK FINL LLC | -18.4% | -17 | 76 | 93 | 3 |
| 4 | RAKUTN 5Y | RAKUTEN INC | -15.8% | -102 | 547 | 649 | 4 |
| 5 | RAI 5Y | RJ REYNOLDS TOBACCO HOLDINGS INC | -15.2% | -8 | 44 | 52 | 3 |
| 6 | PNLNA 5Y | POSTNL NV | -13.6% | -17 | 105 | 122 | 7 |
| 7 | HAL 5Y | DRESSER INDS INC | -13.1% | -8 | 53 | 61 | 5 |
| 8 | EQM 5Y | EQT MIDSTREAM PARTNERS L P | -12.5% | -18 | 126 | 144 | 3 |
| 9 | ITVLN 5Y | ITV PLC | -12.3% | -17 | 118 | 134 | 8 |
| 10 | HON 5Y | ALLIED SIGNAL INC | -11.5% | -3 | 25 | 29 | 4 |
Top 10 Underperformers
Showcases the top 10 IG CDS “underperformers” based on the largest mid spread increases between 8/1/23 – 8/31/23
| RANK | BOND NAME | ISSUER | % CHANGE | BPS CHANGE | SPRD | SPRD-1 MONTH | DEALERS |
|---|---|---|---|---|---|---|---|
| 1 | DXC 5Y | DXC TECHNOLOGY CO | 46.4% | 70 | 221 | 151 | 3 |
| 2 | BCHINA 5Y | BANK CHINA LTD | 45.8% | 31 | 98 | 67 | 3 |
| 3 | CCBC 5Y | CHINA CONSTR BK CORP INSTL CTF | 44.4% | 30 | 98 | 68 | 3 |
| 4 | BOCOM 5Y | BANK OF COMMUNICATIONS (UK) LIMITED | 40.2% | 29 | 100 | 71 | 2 |
| 5 | CHGRID 5Y | STATE GRID CORPORATION OF CHINA | 33.7% | 22 | 88 | 66 | 3 |
| 6 | CHIOLI 5Y | CHINA OVERSEAS LAND & INVESTMENT LTD | 31.1% | 34 | 145 | 111 | 2 |
| 7 | SCFER HOLDCO 5Y | SCHAEFFLER FINANCE BV | 27.4% | 47 | 220 | 173 | 4 |
| 8 | AES 5Y | AES TRUST I | 27.0% | 31 | 148 | 117 | 3 |
| 9 | NIPYU 5Y | NIPPON YUSEN KK | 26.0% | 11 | 55 | 43 | 4 |
| 10 | AXPRS 5Y | AMERICAN EXPRESS BK FSB MEDIUM | 21.7% | 8.1 | 45 | 37 | 4 |
Normalized IG Spread by Region
Displays the IG CDS spread by region between 8/1/23 – 8/31/23 Results are based on 5 select regions, however, we offer data across 12 regions
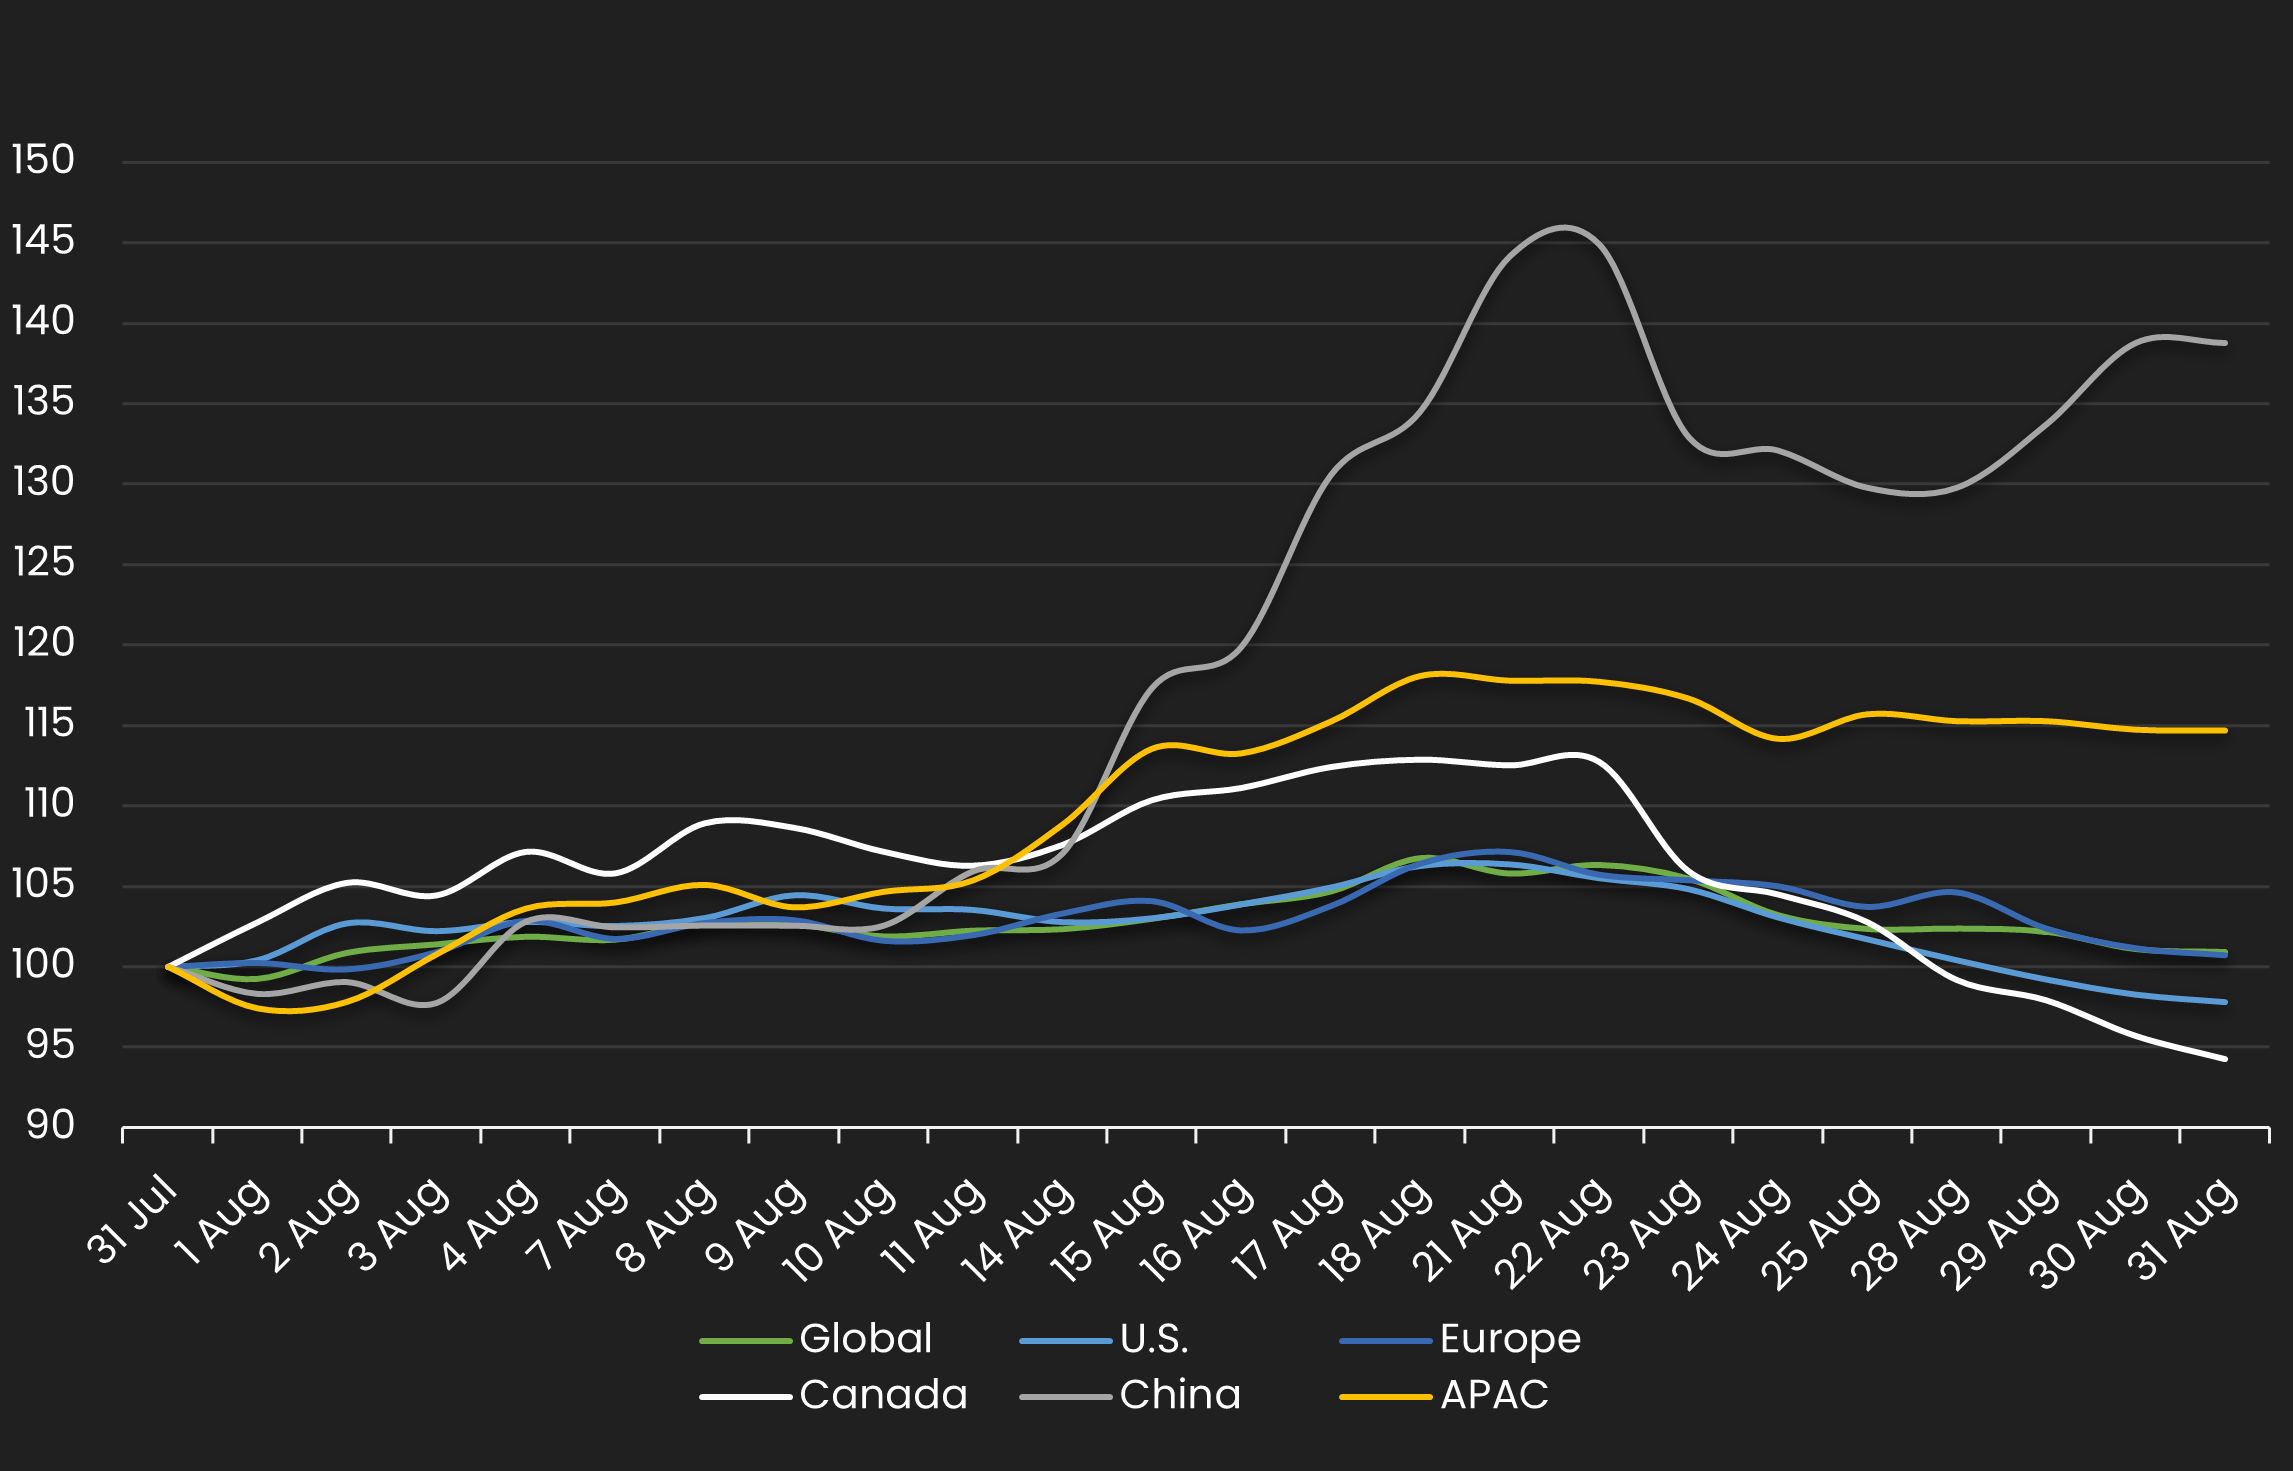
IG Spread by Region – Monthly Comparison
Exhibits the IG mid spread by region for the month ending 7/31/23 vs. the month ending 8/31/23
| REGION | PREVIOUS SPREAD | CURRENT SPREAD | BPS CHANGE | MONTHLY PERFORMANCE | CDS COUNT |
|---|---|---|---|---|---|
| Global | 60 | 61 | 1 | Wider | 497 |
| U.S. | 60 | 59 | -1 | Tighter | 171 |
| Europe | 62 | 63 | 1 | Wider | 148 |
| Canada | 59 | 55 | -3 | Tighter | 5 |
| China | 68 | 94 | 26 | Wider | 8 |
| APAC | 48 | 55 | 7 | Wider | 41 |
Normalized IG Spread by Industry
Displays the IG CDS spread by industry between 8/1/23 – 8/31/23 Results are based on 5 select industry sectors, however, we offer data across 36 sectors
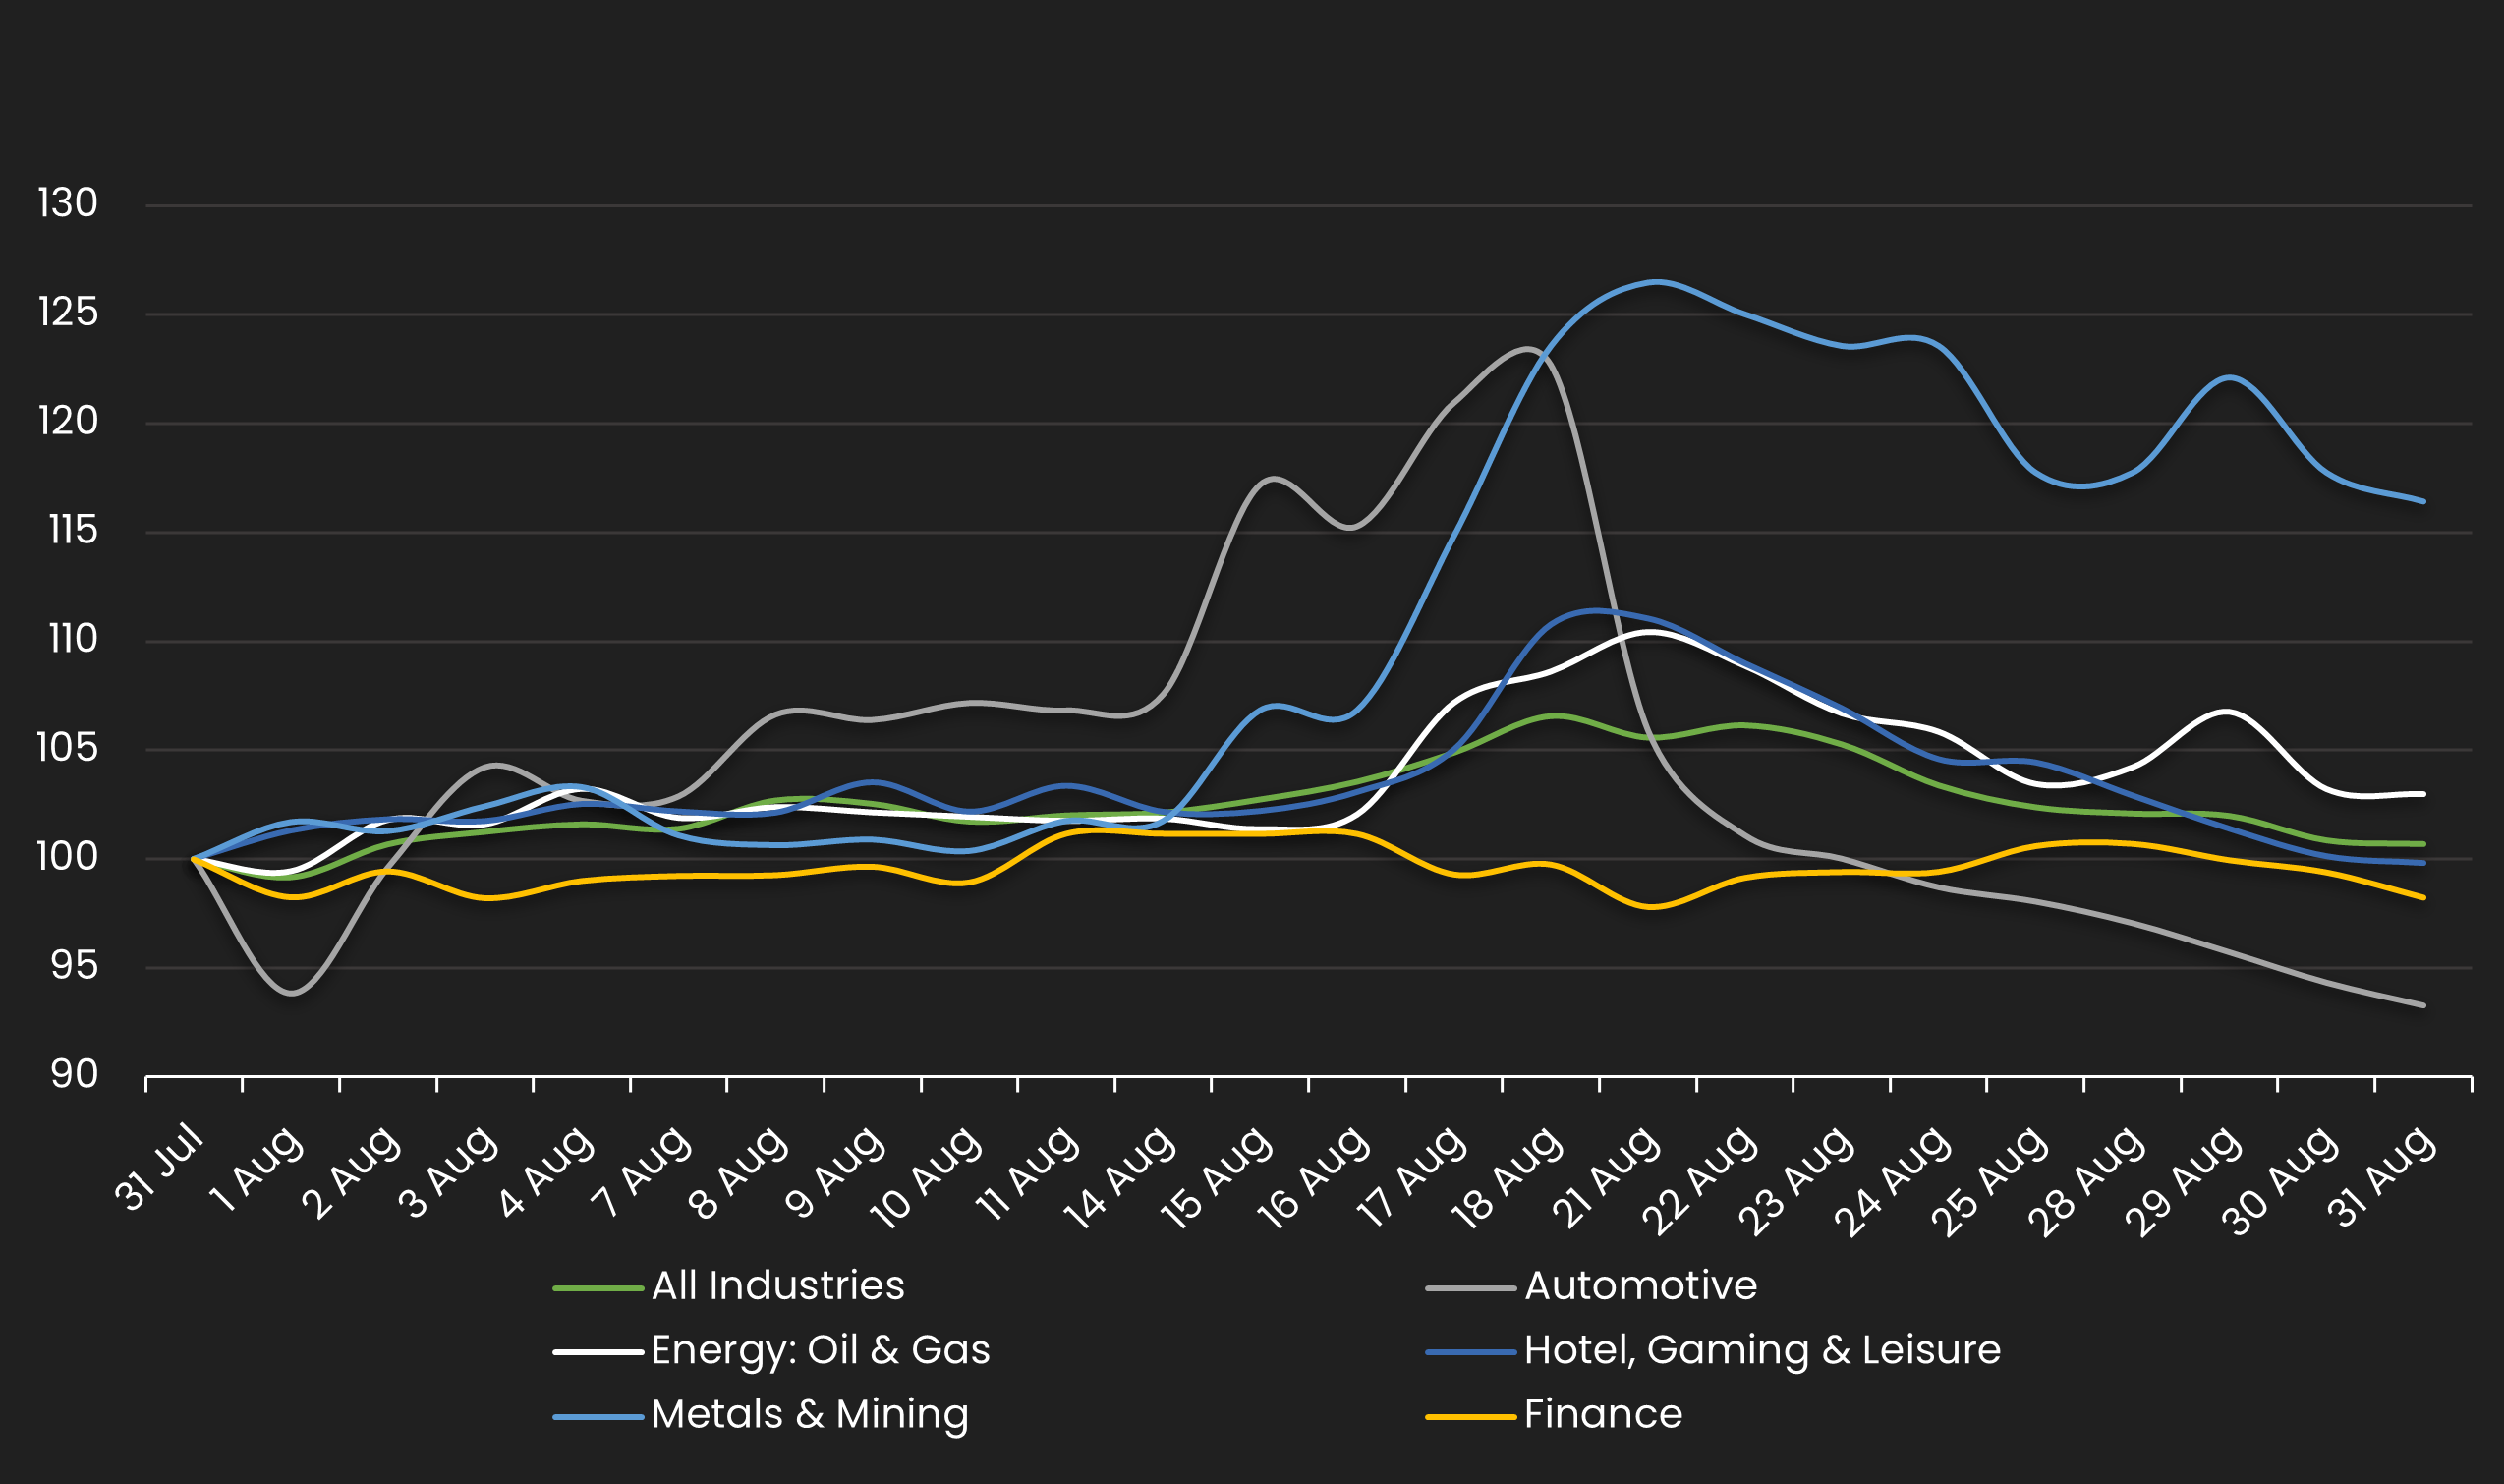
IG Spread by Industries – Monthly Comparison
Exhibits the IG spread by industry for the month ending 7/31/23 vs. the month ending 8/31/23
| INDUSTRIES | PREVIOUS SPREAD | CURRENT SPREAD | BPS CHANGE | MONTHLY PERFORMANCE | CDS COUNT |
|---|---|---|---|---|---|
| All Industries | 60 | 61 | 1 | Wider | 498 |
| Automotive | 84 | 79 | -6 | Tighter | 16 |
| Energy: Oil & Gas | 69 | 71 | 2 | Wider | 28 |
| Hotel, Gaming & Leisure | 61 | 60 | -1 | Tighter | 3 |
| Metals & Mining | 69 | 80 | 11 | Wider | 17 |
| Finance | 70 | 69 | -1 | Tighter | 40 |
Stay up-to-date with monthly summaries.
Related Resources
About SOLVE
SOLVE is the leading market data platform provider for fixed-income securities, trusted by sophisticated buy-side and sell-side firms worldwide. Founded in 2011, SOLVE leverages its AI-driven technology and deep industry expertise to offer unparalleled transparency into markets, reduce risk, and save hundreds of hours across front-office workflows. With the largest real-time datasets for Securitized Products, Municipal Bonds, Corporate Bonds, Syndicated Bank Loans, Convertible Bonds, CDS, and Private Credit, SOLVE empowers clients to transform the way they bring new securities to market, trade on secondary markets, and value highly illiquid securities. Headquartered in Connecticut, with offices across the globe, SOLVE is the definitive source for market pricing in fixed-income markets.
