High Yield CDS Market Summary – November 2023
GET OUR CDS MARKET SUMMARIES STRAIGHT TO YOUR INBOX. LEARN MORE
High Yield CDS Market Summary:November 2023
Our newsletter presents key trends derived from observable Credit Default Swaps pricing data over a monthly period.
Top 10 Outperformers
Showcases the top 10 HY CDS “outperformers” based on the largest mid spread decreases between 11/1/23 – 11/30/23
| RANK | BOND NAME | ISSUER | % CHANGE | BPS CHANGE | SPRD | SPRD-1 MONTH | DEALERS |
|---|---|---|---|---|---|---|---|
| 1 | TGNA 5Y | TEGNA INC | -42.7% | -154 | 208 | 362 | 3 |
| 2 | SIG 5Y | REYNOLDS GROUP HOLDINGS LIMITED | -39.3% | -106 | 164 | 270 | 3 |
| 3 | RAYAC 5Y | REXEL | -37.7% | -88 | 145 | 233 | 6 |
| 4 | EQM 5Y | EQT MIDSTREAM PARTNERS L P | -37.2% | -67 | 112 | 179 | 3 |
| 5 | SAIBV 5Y | SAIPEM FINANCE INTERNATIONAL BV | -36.6% | -141 | 244 | 385 | 4 |
| 6 | BYD 5Y | BOYD GAMING CORP | -34.2% | -71 | 136 | 207 | 4 |
| 7 | OLN 5Y | OLIN CORP | -34.1% | -74 | 142 | 216 | 3 |
| 8 | LPX 5Y | LP PINEWOOD SPV LLC | -33.7% | -51 | 100 | 151 | 3 |
| 9 | RCL 5Y | ROYAL CARIBBEAN CRUISES LTD | -33.5% | -125 | 249 | 374 | 4 |
| 10 | ASH 5Y | ASHLAND GLOBAL HOLDINGS | -33.4% | -51 | 102 | 153 | 3 |
Top 10 Underperformers
Showcases the top 10 HY CDS “underperformers” based on the largest mid spread increases between 11/1/23 – 11/30/23
| RANK | BOND NAME | ISSUER | % CHANGE | BPS CHANGE | SPREAD | SPREAD-1 MONTH | DEALERS |
|---|---|---|---|---|---|---|---|
| 1 | UNILAB 5Y | UNILABS HOLDINGS SA | 37.1% | 30 | 110 | 80 | 2 |
| 2 | OXY 5Y | OCCIDENTAL PETE CORP | 12.9% | 12 | 108 | 96 | 6 |
| 3 | NIDHEA 5Y | STADA ARZNEIMITTEL AG | 9.9% | 16 | 174 | 158 | 2 |
| 4 | EGBLFN 5Y | EG GLOBAL FINANCE PLC | 9.4% | 55 | 639 | 584 | 3 |
| 5 | HPLGR 5Y | HAPAG-LLOYD A G | 8.2% | 23 | 308 | 285 | 4 |
| 6 | SCFER 5Y | SCHAEFFLER FINANCE BV | 5.9% | 9 | 152 | 144 | 3 |
| 7 | PPFTEL 5Y | PPF TELECOM GROUP BV | 4.8% | 5 | 109 | 104 | 2 |
| 8 | TOKELP 5Y | TOKYO ELECTRIC POWER CO HOLDINGS INC | 1.2% | 1 | 62 | 61 | 3 |
| 9 | CMACG 5Y | CMA CGM S A | 0.9% | 2 | 239 | 237 | 4 |
| 10 | ARM 5Y | ARVIN CAP I | 0.5% | 0 | 33 | 33 | 2 |
Normalized HY Spread by Region
Displays the HY CDS spread by region between 11/1/23 – 11/30/23 Results are based on 5 select regions, however, we offer data across 12 regions
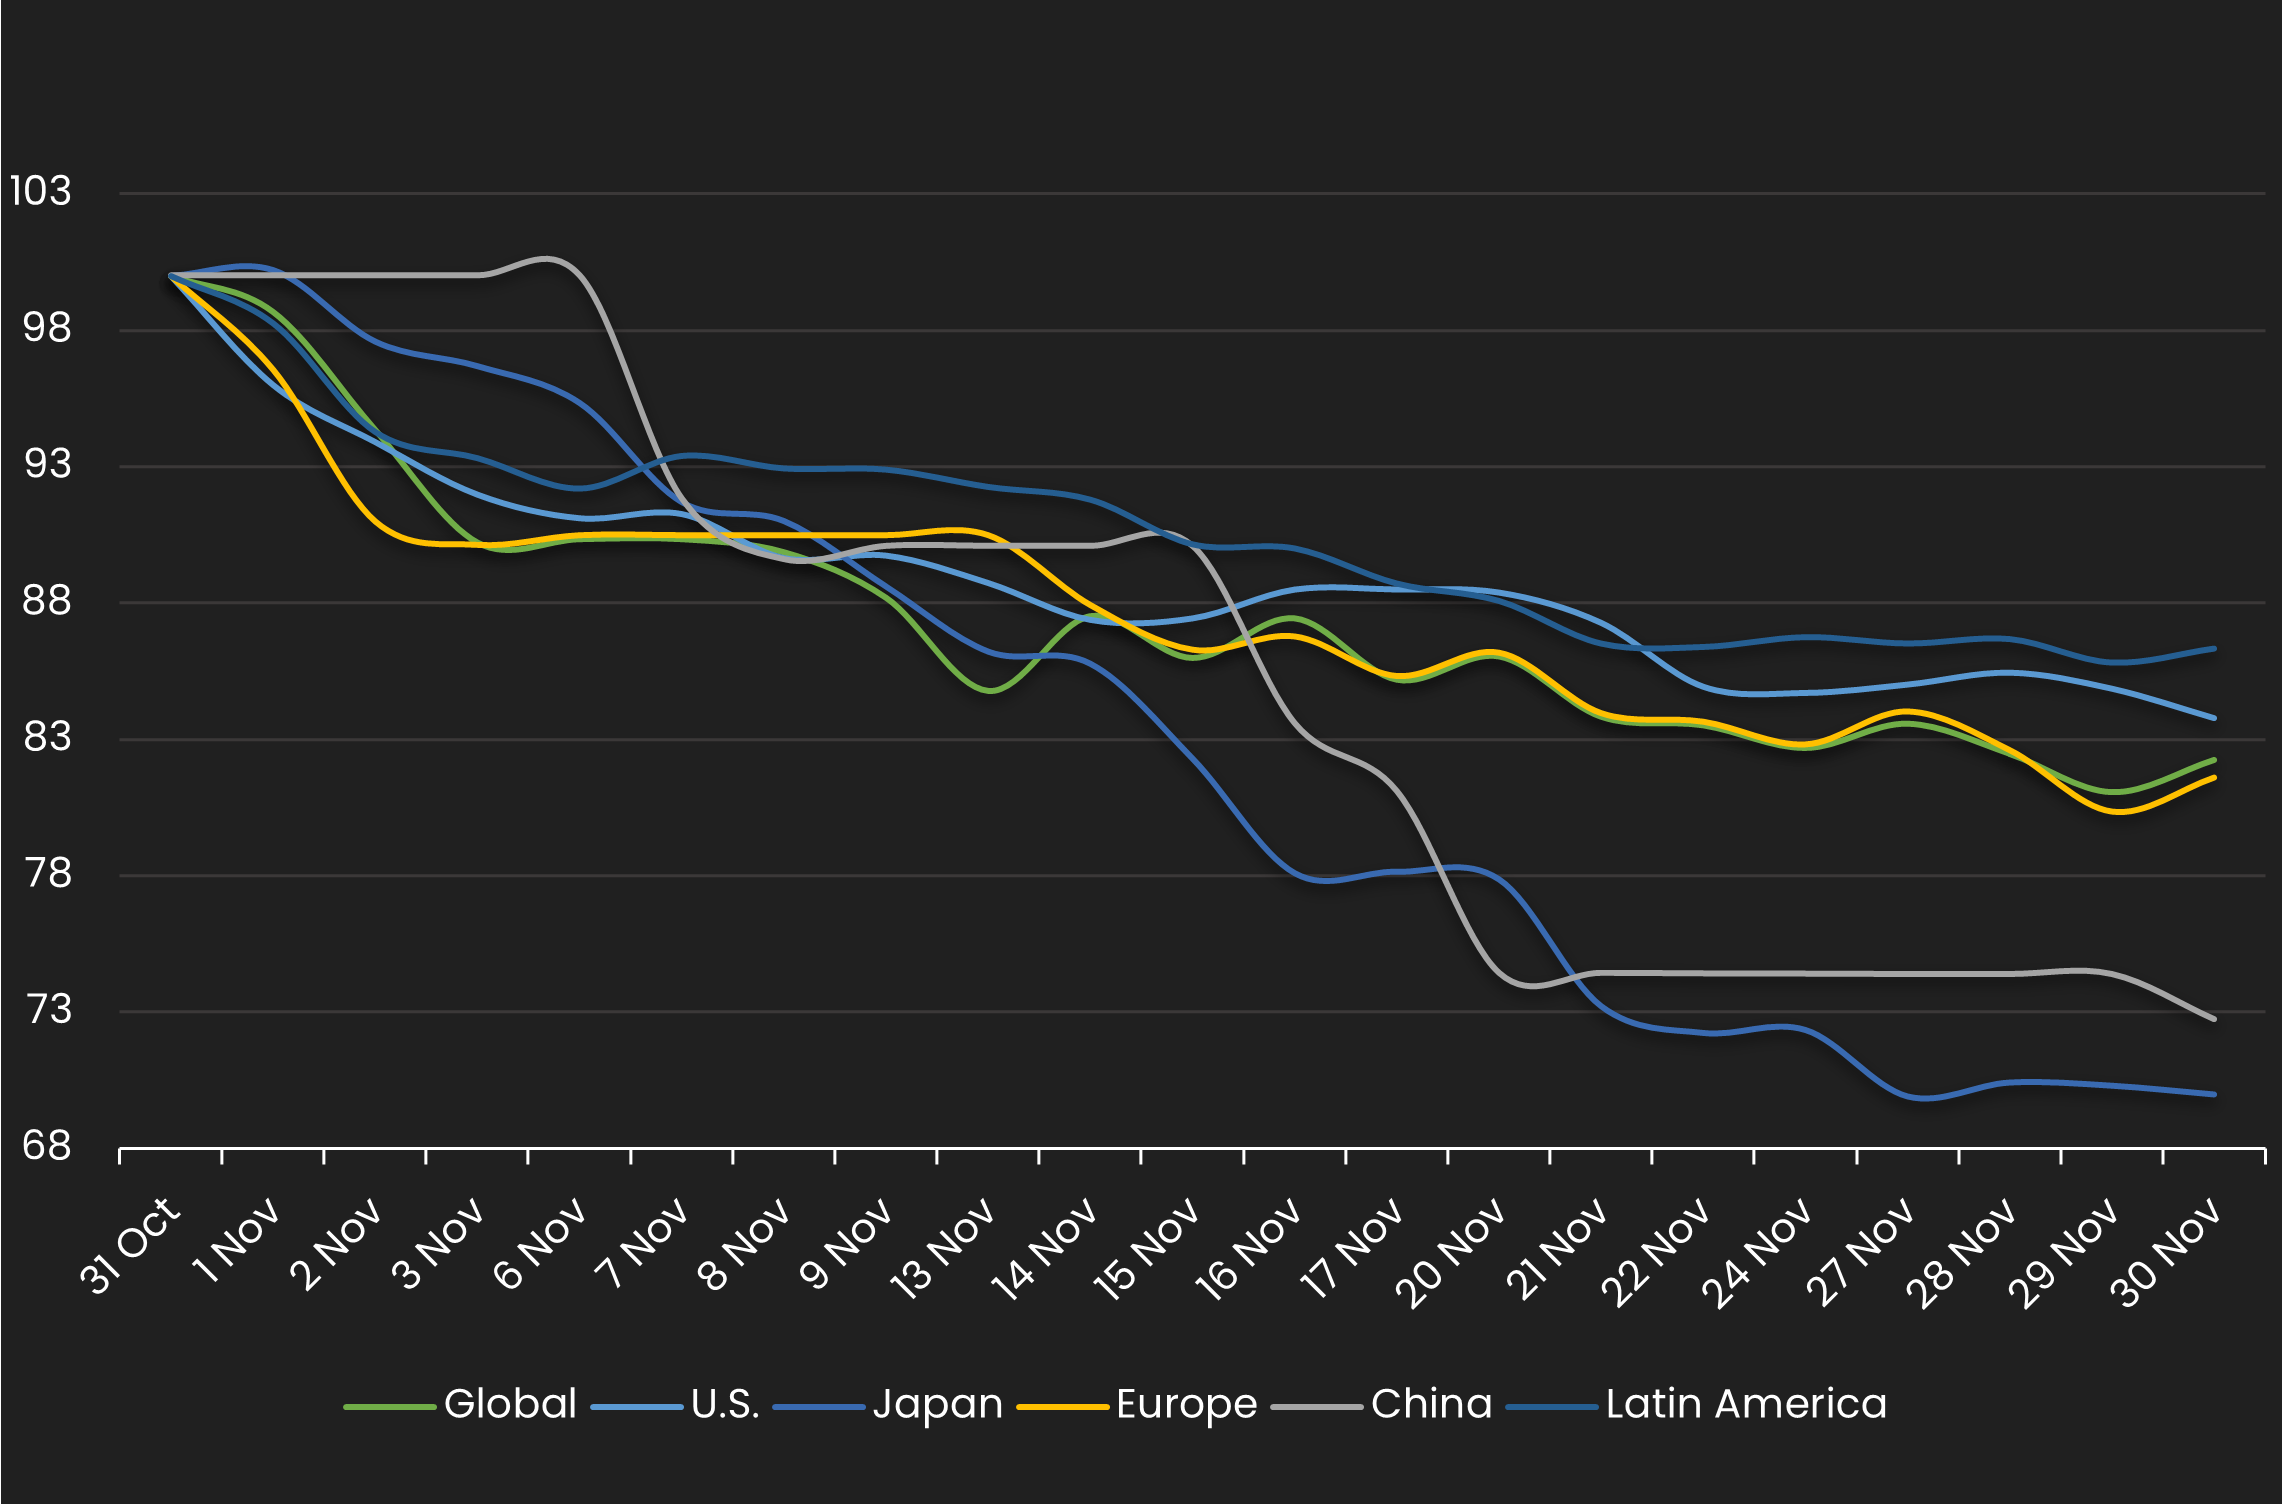
HY Spread by Region – Monthly Comparison
Exhibits the HY mid spread by region for the month ending 10/31/23 vs. the month ending 11/30/23
| REGION | PREVIOUS SPREAD | CURRENT SPREAD | BPS CHANGE | MONTHLY PERFORMANCE | CDS COUNT |
|---|---|---|---|---|---|
| Global | 232 | 191 | -41 | Tighter | 179 |
| U.S. | 222 | 186 | -36 | Tighter | 87 |
| Japan | 288 | 202 | -87 | Tighter | 5 |
| Europe | 232 | 189 | -43 | Tighter | 48 |
| China | 121 | 88 | -33 | Tighter | 1 |
| Latin America | 279 | 241 | -38 | Tighter | 4 |
Normalized HY Spread by Industry
Displays the HY CDS spread by industry between 11/1/23 – 11/30/23 Results are based on 5 select industry sectors, however, we offer data across 36 sectors
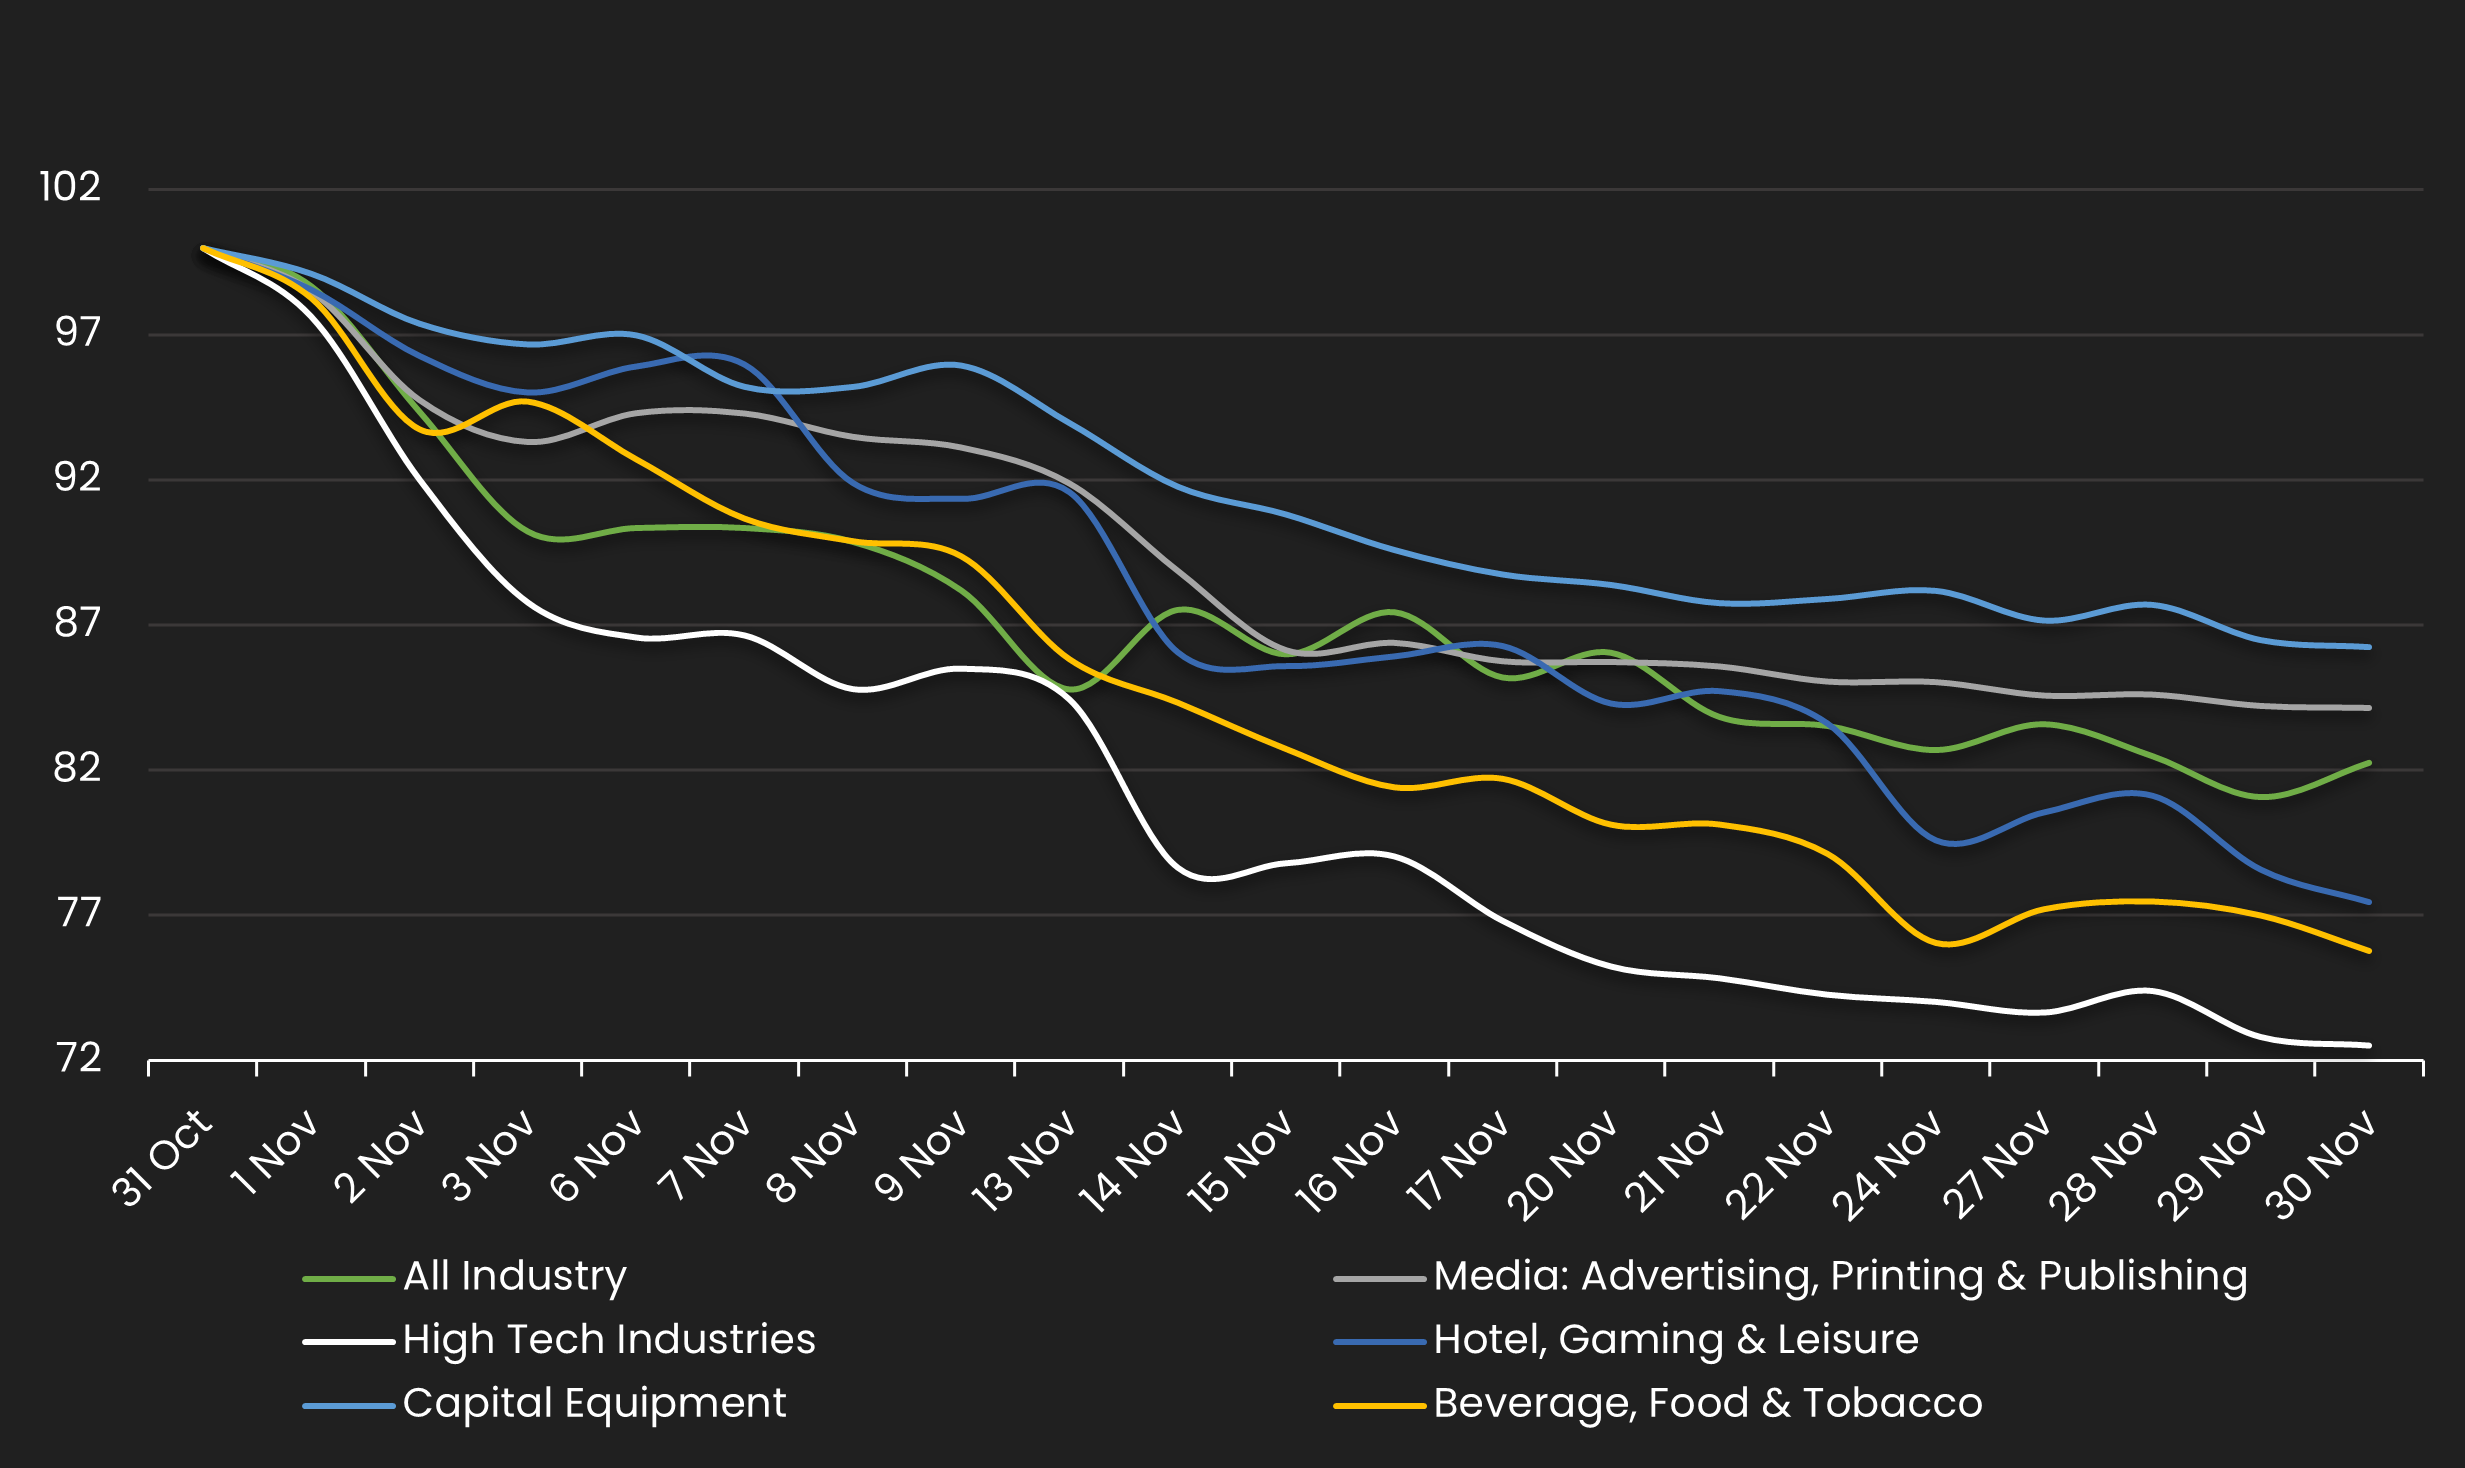
HY Spread by Industries – Monthly Comparison
Exhibits the HY spread by industry for the month ending 10/31/23 vs. the month ending 11/30/23
| INDUSTRIES | PREVIOUS SPREAD | CURRENT SPREAD | BPS CHANGE | MONTHLY PERFORMANCE | CDS COUNT |
|---|---|---|---|---|---|
| All Industry | 232 | 191 | -41 | Tighter | 179.00 |
| Media: Advertising, Printing & Publishing | 443 | 373 | -70 | Tighter | 1.00 |
| High Tech Industries | 240 | 174 | -66 | Tighter | 4.00 |
| Hotel, Gaming & Leisure | 241 | 187 | -54 | Tighter | 9.00 |
| Capital Equipment | 308 | 266 | -42 | Tighter | 6.00 |
| Beverage, Food & Tobacco | 260 | 197 | -63 | Tighter | 5.00 |
Stay up-to-date with monthly summaries.
Related Resources
About SOLVE
SOLVE is the leading market data platform provider for fixed-income securities, trusted by sophisticated buy-side and sell-side firms worldwide. Founded in 2011, SOLVE leverages its AI-driven technology and deep industry expertise to offer unparalleled transparency into markets, reduce risk, and save hundreds of hours across front-office workflows. With the largest real-time datasets for Securitized Products, Municipal Bonds, Corporate Bonds, Syndicated Bank Loans, Convertible Bonds, CDS, and Private Credit, SOLVE empowers clients to transform the way they bring new securities to market, trade on secondary markets, and value highly illiquid securities. Headquartered in Connecticut, with offices across the globe, SOLVE is the definitive source for market pricing in fixed-income markets.
