High Yield CDS Market Summary – May 2023
GET OUR CDS MARKET SUMMARIES STRAIGHT TO YOUR INBOX. LEARN MORE
High Yield CDS Market Summary:May 2023
Our newsletter presents key trends derived from observable Credit Default Swaps pricing data over a monthly period.
Top 10 Outperformers
Showcases the top 10 HY CDS “outperformers” based on the largest mid spread decreases between 5/1/23 – 5/31/23
| RANK | BOND NAME | ISSUER | % CHANGE | BPS CHANGE | SPRD | SPRD-1 MONTH | DEALERS |
|---|---|---|---|---|---|---|---|
| 1 | RCL 5Y | ROYAL CARIBBEAN CRUISES LTD | -25.3% | -141 | 416 | 557 | 6 |
| 2 | TOKELP 5Y | TOKYO ELECTRIC POWER CO HOLDINGS INC | -25.2% | -22 | 65 | 87 | 3 |
| 3 | GT 5Y | GOODYEAR TIRE & RUBBER CO | -24.0% | -103 | 325 | 428 | 4 |
| 4 | ELTLX 5Y | ELECTROLUX AB | -21.6% | -29 | 105 | 134 | 7 |
| 5 | TVOYFH 5Y | TVO | -20.6% | -20 | 76 | 96 | 3 |
| 6 | GRFSM 5Y | GRIFOLS WORLDWIDE OPERATIONS USA INC | -20.4% | -135 | 526 | 661 | 3 |
| 7 | SOFTBK 5Y | SOFTBANK GROUP CORP | -19.8% | -63 | 253 | 315 | 3 |
| 8 | AMKR 5Y | AMKOR TECHNOLOGY INC | -17.2% | -32 | 155 | 188 | 5 |
| 9 | TARGA 5Y | TARGA RES PARTNERS LP / TARGA | -15.3% | -18 | 101 | 120 | 3 |
| 10 | CITOH 5Y | LE SPORTSAC INC | -15.2% | -4 | 21 | 25 | 3 |
Top 10 Underperformers
Showcases the top 10 HY CDS “underperformers” based on the largest mid spread increases between 5/1/23 – 5/31/23
| RANK | BOND NAME | ISSUER | % CHANGE | BPS CHANGE | SPREAD | SPREAD-1 MONTH | DEALERS |
|---|---|---|---|---|---|---|---|
| 1 | IRM 5Y | IRON MOUNTAIN INCORPORATED | 20.5% | 32 | 188 | 156 | 3 |
| 2 | SEE 5Y | SEALED AIR CORP NEW | 16.6% | 24 | 166 | 142 | 3 |
| 3 | TCKCN 5Y | TECK RESOURCES LIMITED | 16.1% | 22 | 161 | 138 | 3 |
| 4 | NFLX 5Y | NETFLIX INC | 15.9% | 11 | 82 | 71 | 7 |
| 5 | MGM 5Y | MGM RESORTS INTERNATIONAL | 15.5% | 34 | 257 | 223 | 4 |
| 6 | NAVI 5Y | SLM CORP MEDIUM TERM NTS BOOK | 14.6% | 61 | 479 | 418 | 4 |
| 7 | UPC 5Y | UPC HOLDING BV | 13.8% | 50 | 414 | 364 | 6 |
| 8 | RRD 5Y | DONNELLEY R R & SONS CO | 13.0% | 38 | 333 | 295 | 3 |
| 9 | MBIA_AA 5Y | MBIA INC | 12.0% | 43 | 399 | 356 | 3 |
| 10 | BOMB 5Y | BOMBARDIER CAP TR | 11.9% | 43 | 402 | 359 | 4 |
Normalized HY Spread by Region
Displays the HY CDS spread by region between 5/1/23 – 5/31/23 Results are based on 5 select regions, however, we offer data across 12 regions
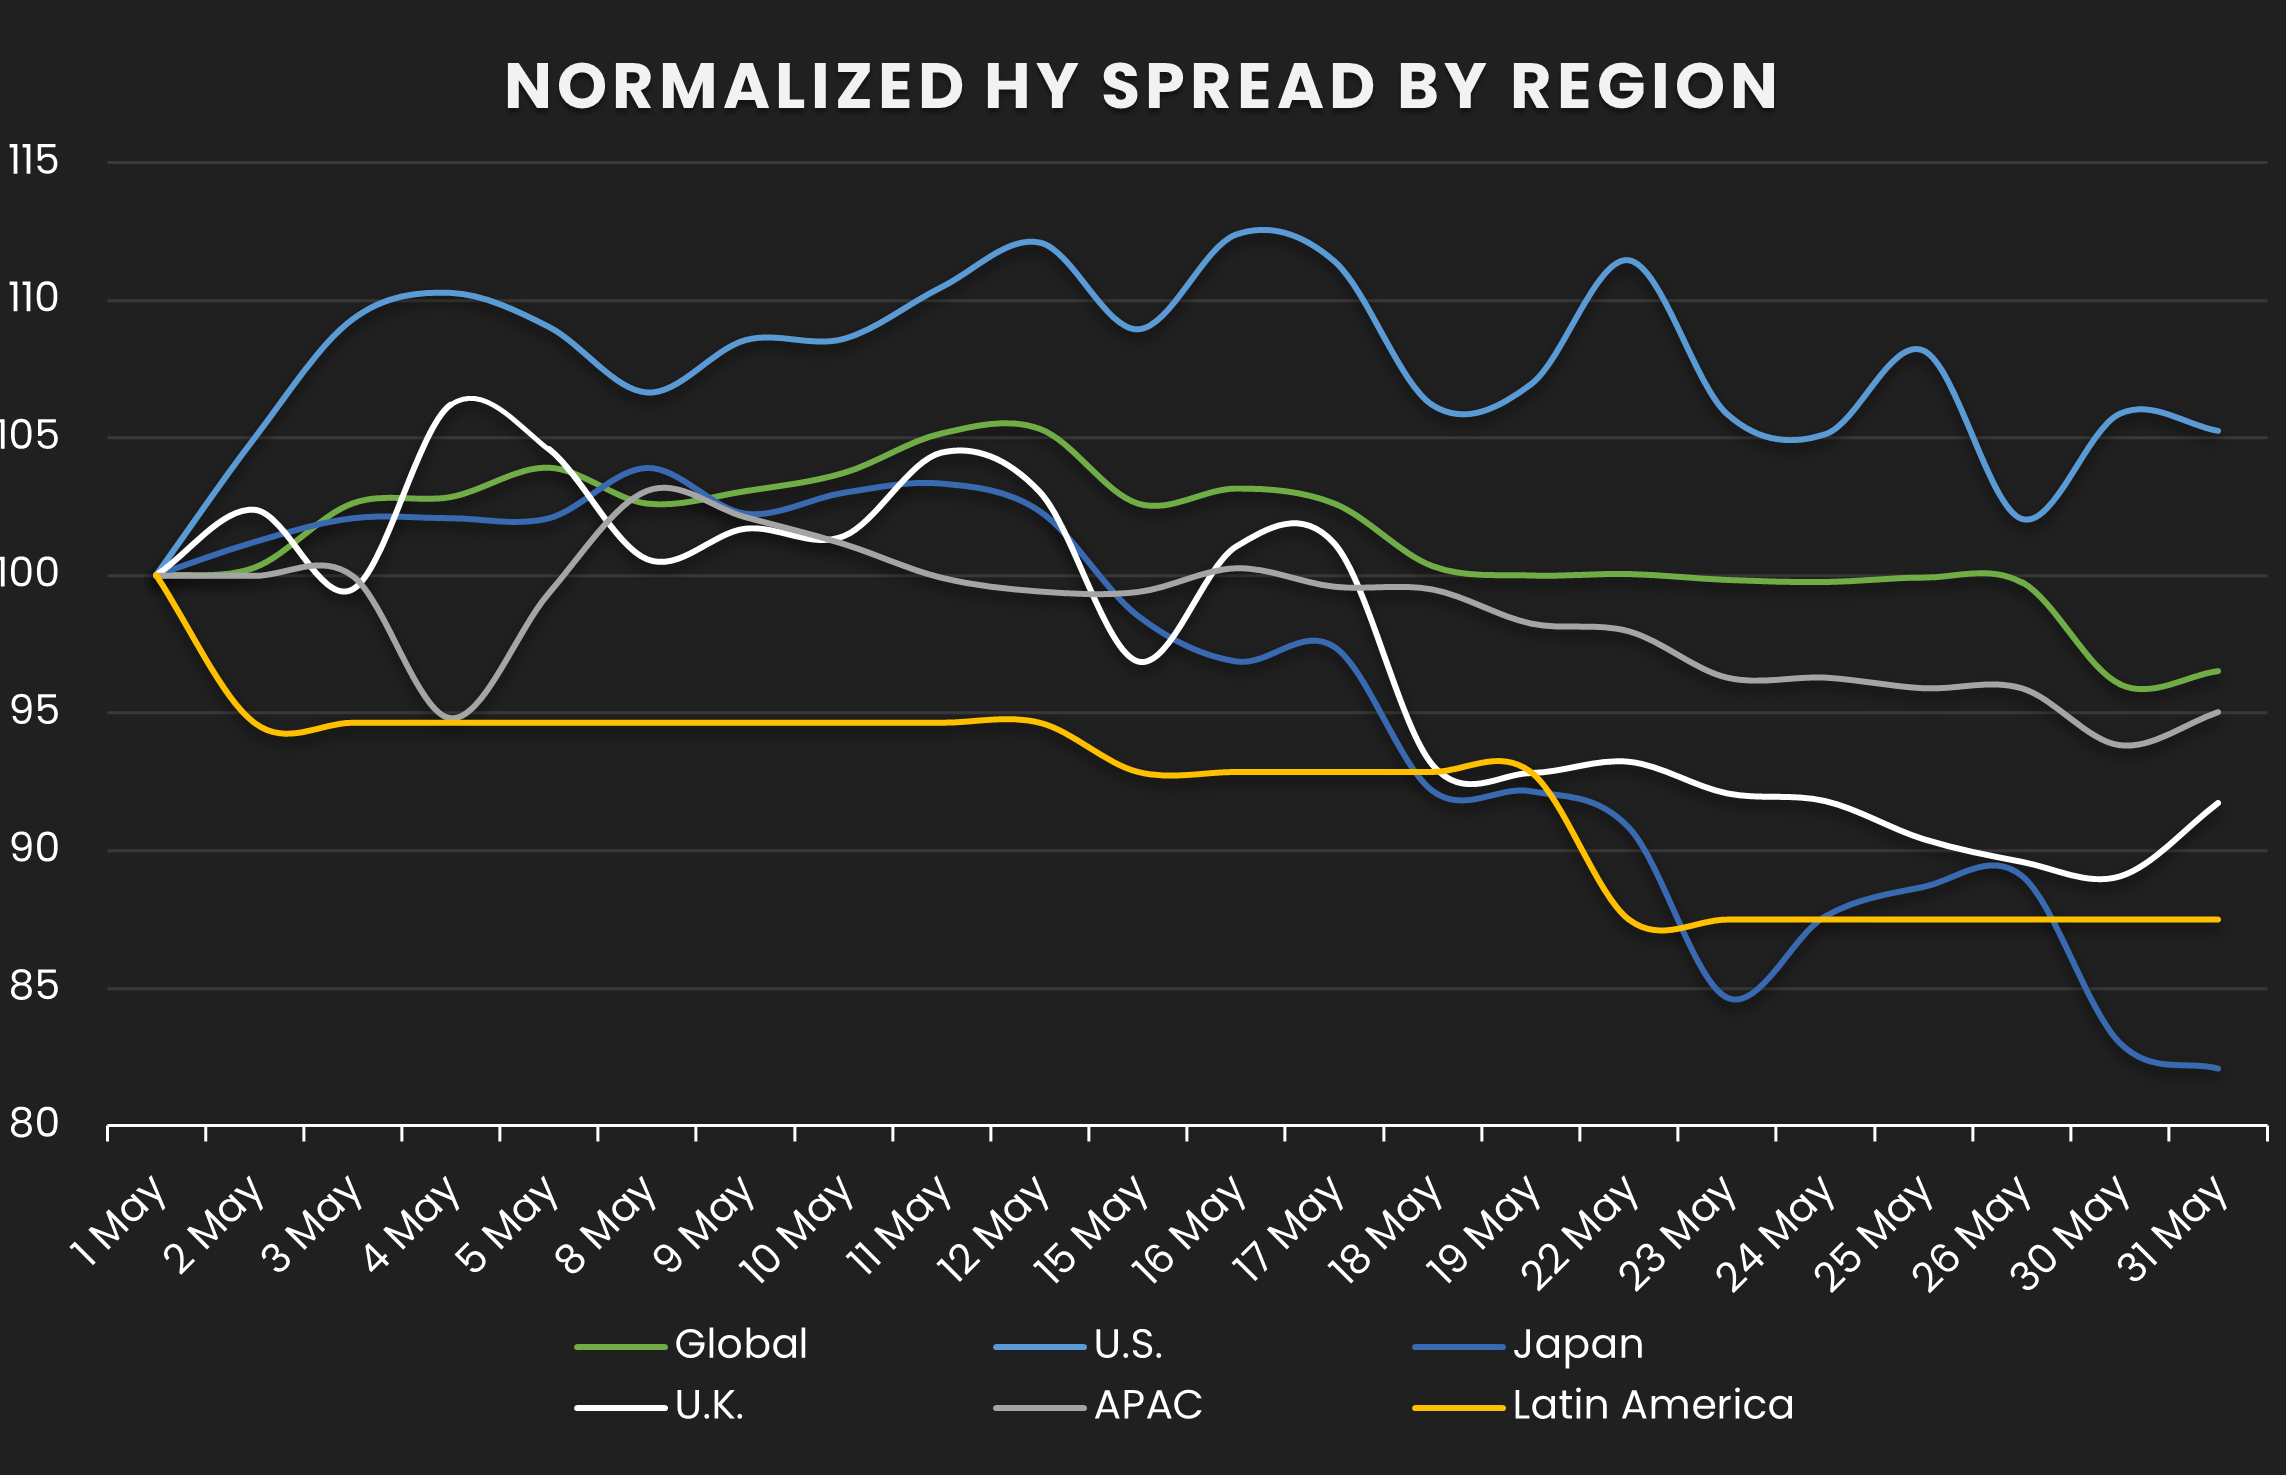
HY Spread by Region – Monthly Comparison
Exhibits the HY mid spread by region for the month ending 4/30/23 vs. the month ending 5/31/23
| REGION | PREVIOUS SPREAD | CURRENT SPREAD | BPS CHANGE | MONTHLY PERFORMANCE | CDS COUNT |
|---|---|---|---|---|---|
| Global | 166 | 160 | -6 | Tighter | 250 |
| U.S. | 147 | 155 | 8 | Wider | 139 |
| Japan | 201 | 165 | -36 | Tighter | 4 |
| U.K. | 101 | 93 | -8 | Tighter | 15 |
| APAC | 124 | 118 | -6 | Tighter | 5 |
| Latin America | 280 | 245 | -35 | Tighter | 8 |
Normalized HY Spread by Industry
Displays the HY CDS spread by industry between 5/1/23 – 5/31/23 Results are based on 5 select industry sectors, however, we offer data across 36 sectors
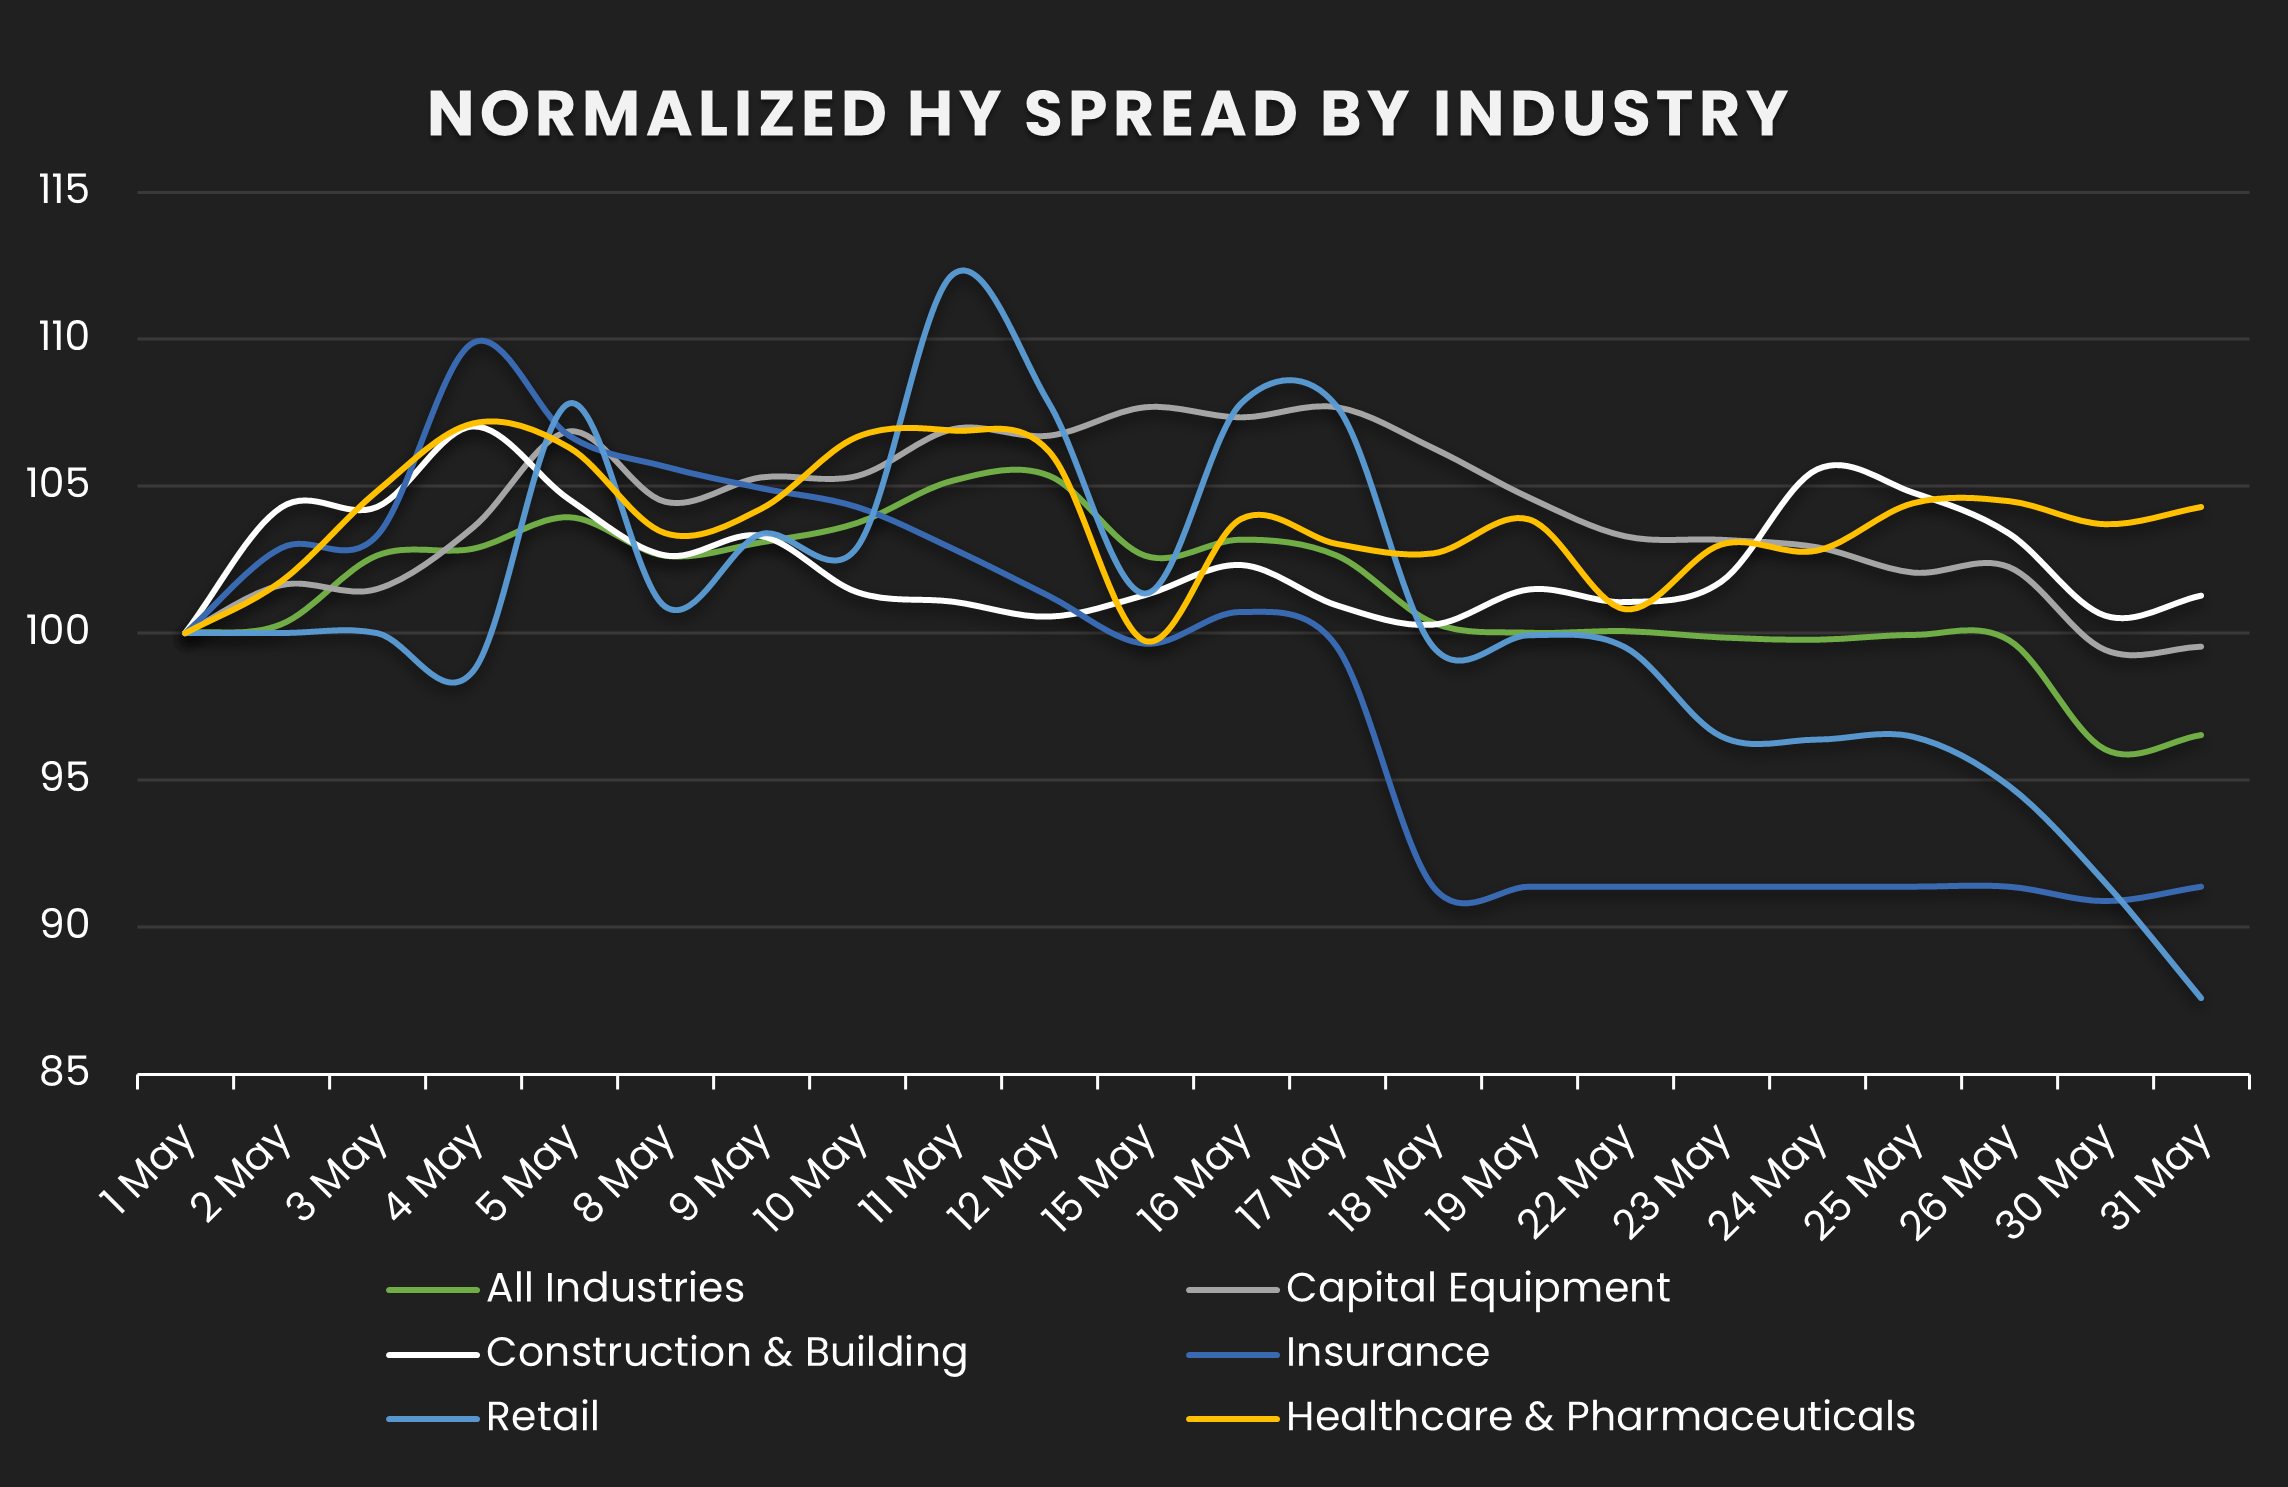
HY Spread by Industries – Monthly Comparison
Exhibits the HY spread by industry for the month ending 4/30/23 vs. the month ending 5/31/23
| INDUSTRIES | PREVIOUS SPREAD | CURRENT SPREAD | BPS CHANGE | MONTHLY PERFORMANCE | CDS COUNT |
|---|---|---|---|---|---|
| All Industries | 166 | 160 | -6 | Tighter | 250.00 |
| Capital Equipment | 361 | 307 | -54 | Tighter | 7.00 |
| Construction & Building | 101 | 103 | 1 | Wider | 7.00 |
| Insurance | 98 | 90 | -8 | Tighter | 7.00 |
| Retail | 132 | 115 | -16 | Tighter | 10.00 |
| Healthcare & Pharmaceuticals | 130 | 136 | 6 | Wider | 8.00 |
Stay up-to-date with monthly summaries.
Related Resources
About SOLVE
SOLVE is the leading market data platform provider for fixed-income securities, trusted by sophisticated buy-side and sell-side firms worldwide. Founded in 2011, SOLVE leverages its AI-driven technology and deep industry expertise to offer unparalleled transparency into markets, reduce risk, and save hundreds of hours across front-office workflows. With the largest real-time datasets for Securitized Products, Municipal Bonds, Corporate Bonds, Syndicated Bank Loans, Convertible Bonds, CDS, and Private Credit, SOLVE empowers clients to transform the way they bring new securities to market, trade on secondary markets, and value highly illiquid securities. Headquartered in Connecticut, with offices across the globe, SOLVE is the definitive source for market pricing in fixed-income markets.
