High Yield CDS Market Summary – January 2024
GET OUR CDS MARKET SUMMARIES STRAIGHT TO YOUR INBOX. LEARN MORE
High Yield CDS Market Summary:January 2024
Our newsletter presents key trends derived from observable Credit Default Swaps pricing data over a monthly period.
Top 10 Outperformers
Showcases the top 10 HY CDS “outperformers” based on the largest mid spread decreases between 1/1/24 – 1/31/24
| RANK | BOND NAME | ISSUER | % CHANGE | BPS CHANGE | SPRD | SPRD-1 MONTH | DEALERS |
|---|---|---|---|---|---|---|---|
| 1 | HPLGR 5Y | HAPAG-LLOYD A G | -23.4% | -64 | 212 | 276 | 3 |
| 2 | CHK 5Y | CHESAPEAKE ENERGY CORP | -21.9% | -31 | 112 | 143 | 3 |
| 3 | ZFFNGR 5Y | ZF NA CAPITAL | -19.4% | -52 | 218 | 270 | 2 |
| 4 | MTG 5Y | MGIC INVT CORP | -17.9% | -22 | 102 | 124 | 4 |
| 5 | DUFNSW 5Y | DUFRY AG | -16.3% | -33 | 168 | 201 | 3 |
| 6 | CSTM 5Y | CONSTELLIUM NV | -15.4% | -34 | 190 | 224 | 3 |
| 7 | THC 5Y | TENET HEALTHCARE CORP | -14.5% | -36 | 213 | 249 | 4 |
| 8 | MBIA_AA 5Y | MBIA INC | -12.0% | -33 | 245 | 278 | 2 |
| 9 | LHAGR 5Y | DEUTSCHE LUFTHANSA AG | -12.0% | -19 | 141 | 161 | 5 |
| 10 | CZR 5Y | CAESARS ENTERTAINMENT OP | -10.6% | -24 | 205 | 229 | 3 |
Top 10 Underperformers
Showcases the top 10 HY CDS “underperformers” based on the largest mid spread increases between 1/1/24 – 1/31/24
| RANK | BOND NAME | ISSUER | % CHANGE | BPS CHANGE | SPREAD | SPREAD-1 MONTH | DEALERS |
|---|---|---|---|---|---|---|---|
| 1 | GRFSM 5Y | GRIFOLS WORLDWIDE OPERATIONS USA INC | 54.7% | 180 | 509 | 329 | 3 |
| 2 | SCFER 5Y | SCHAEFFLER FINANCE BV | 35.3% | 45 | 172 | 127 | 3 |
| 3 | OI 5Y | OI EUROPEAN GROUP BV | 33.9% | 65 | 257 | 192 | 3 |
| 4 | CLAR 5Y | CLARIANT AG | 23.5% | 26 | 135 | 109 | 5 |
| 5 | RAKUTN 5Y | RAKUTEN INC | 21.4% | 85 | 479 | 394 | 4 |
| 6 | VOVCAB 5Y | VOLVO | 12.3% | 26 | 237 | 211 | 5 |
| 7 | X 5Y | TRANSTAR HLDGS INC | 11.6% | 10 | 100 | 89 | 6 |
| 8 | MARSPE 5Y | MARKS & SPENCER PLC | 11.6% | 11 | 110 | 98 | 5 |
| 9 | AFKLM 5Y | AIR FRANCE-KLM | 11.5% | 24 | 228 | 205 | 6 |
| 10 | AES 5Y | AES TRUST I | 9.3% | 11 | 128 | 118 | 5 |
Normalized HY Spread by Region
Displays the HY CDS spread by region between 1/1/24 – 1/31/24 Results are based on 5 select regions, however, we offer data across 12 regions
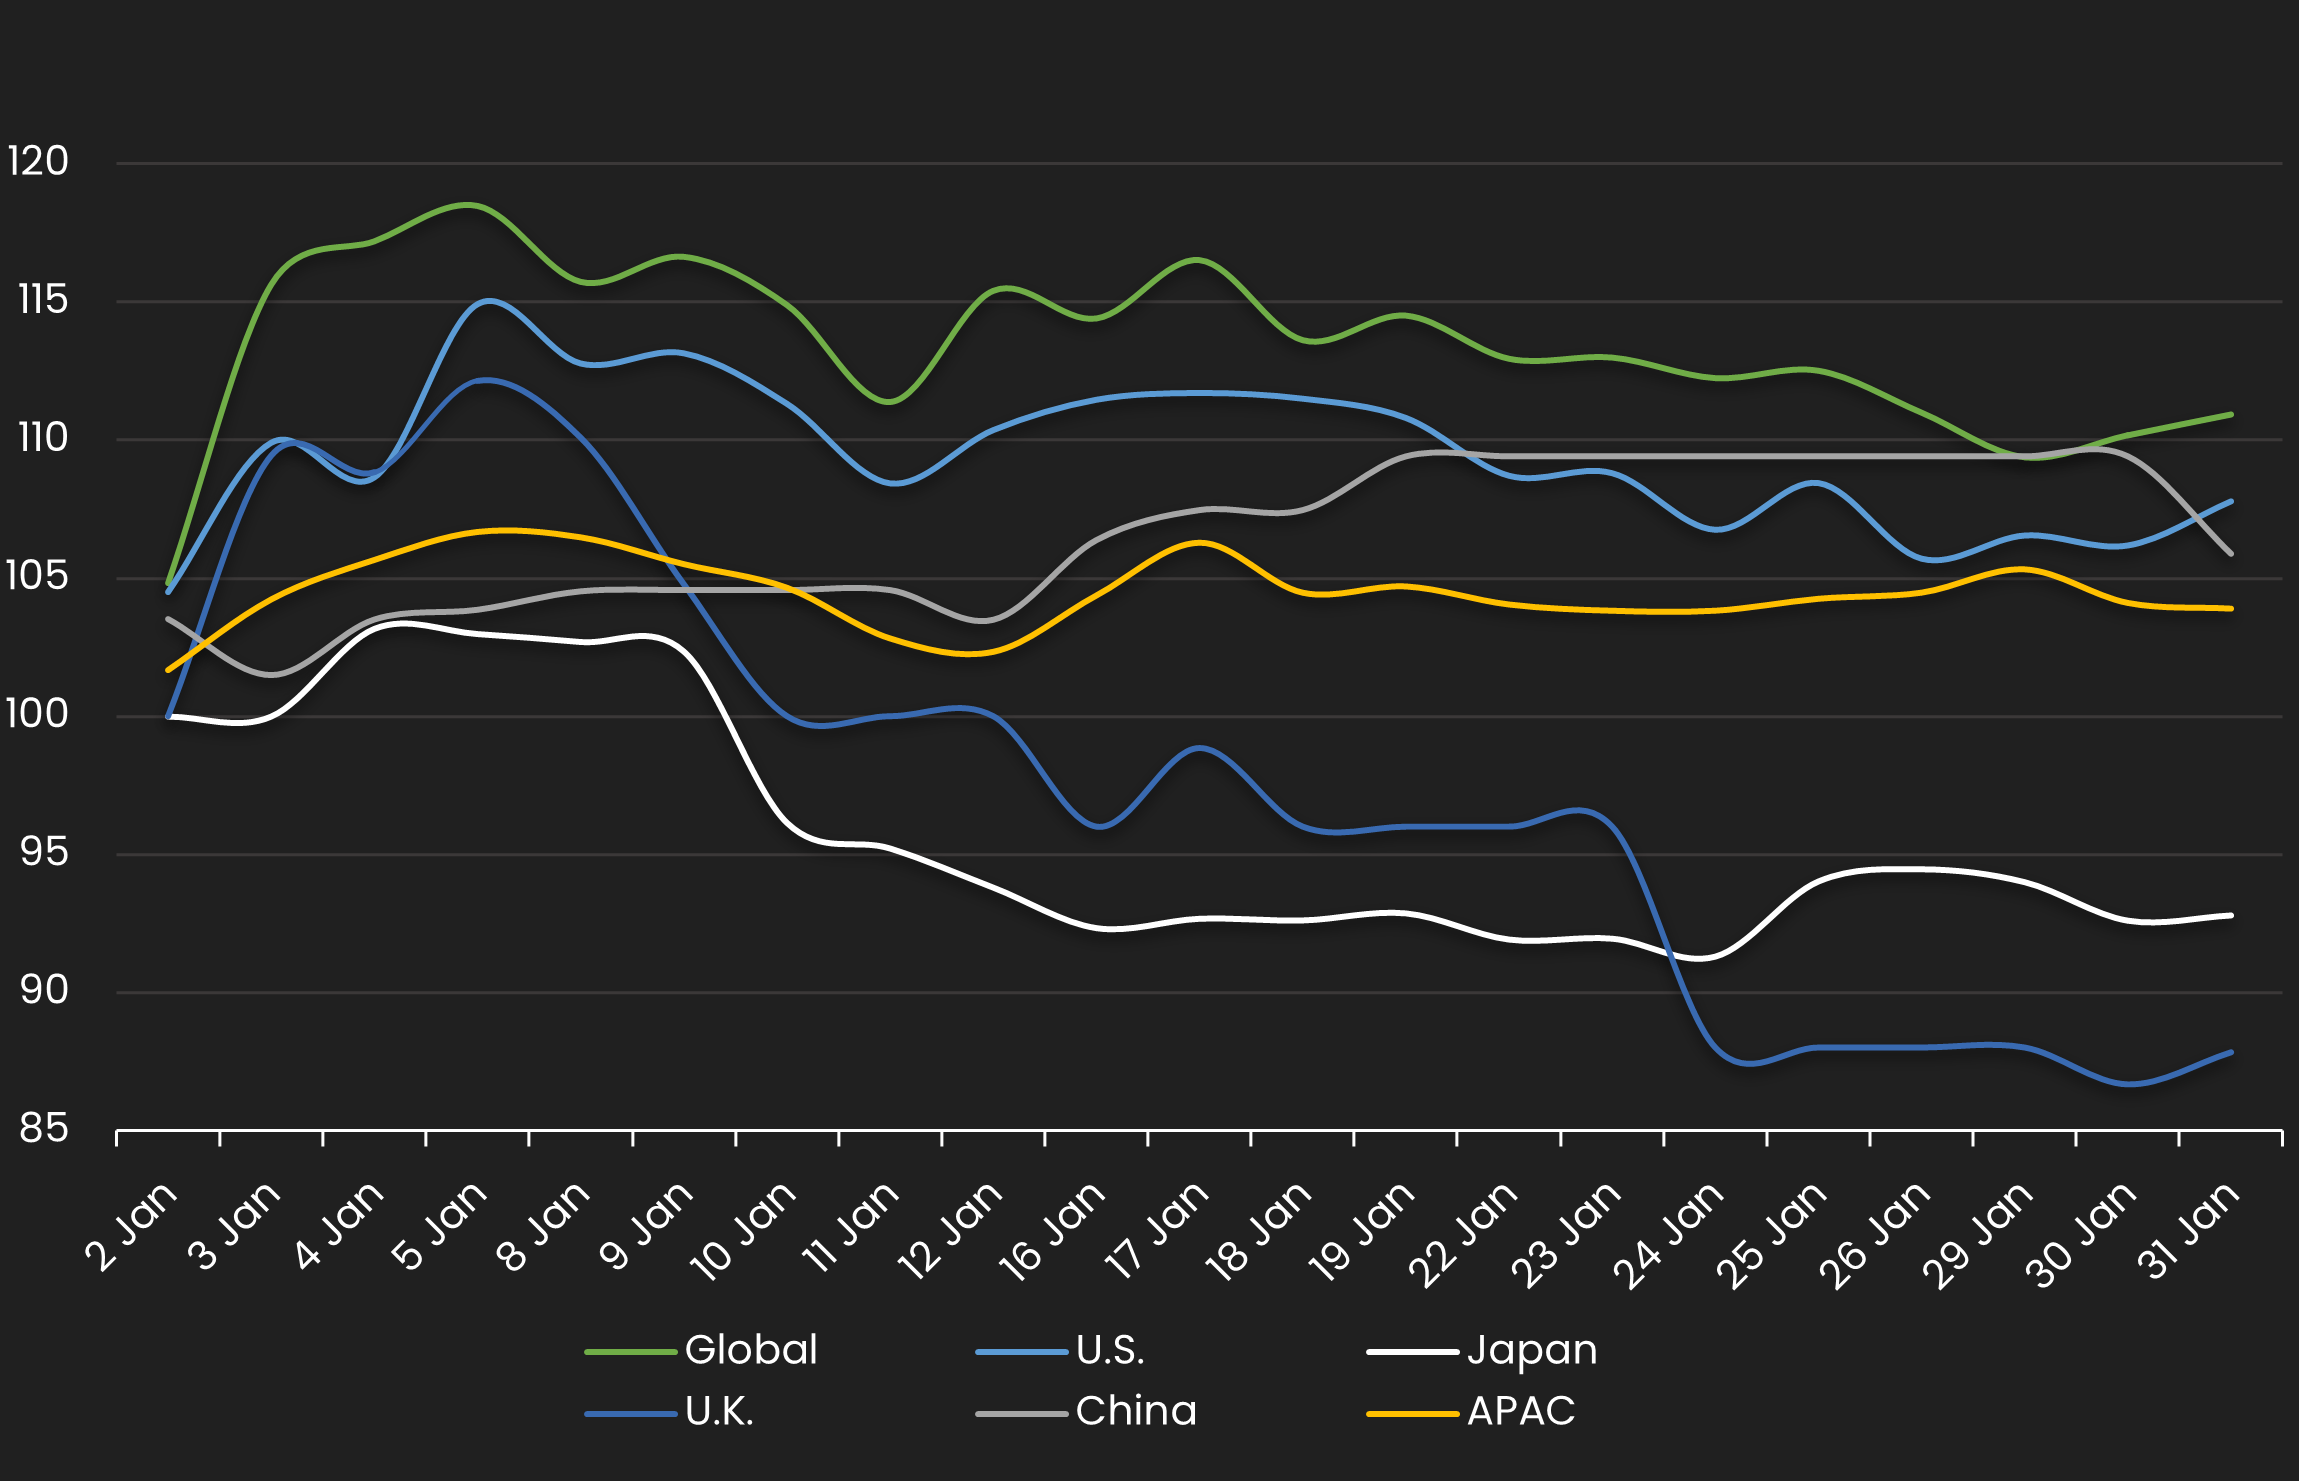
HY Spread by Region – Monthly Comparison
Exhibits the HY mid spread by region for the month ending 12/31/23 vs. the month ending 1/31/24
| REGION | PREVIOUS SPREAD | CURRENT SPREAD | BPS CHANGE | MONTHLY PERFORMANCE | CDS COUNT |
|---|---|---|---|---|---|
| Global | 156 | 173 | 17 | Wider | 186 |
| U.S. | 154 | 166 | 12 | Wider | 91 |
| Japan | 191 | 177 | -14 | Tighter | 5 |
| U.K. | 125 | 110 | -15 | Tighter | 16 |
| China | 85 | 90 | 5 | Wider | 1 |
| APAC | 120 | 125 | 5 | Wider | 1 |
Normalized HY Spread by Industry
Displays the HY CDS spread by industry between 1/1/24 – 1/31/24 Results are based on 5 select industry sectors, however, we offer data across 36 sectors
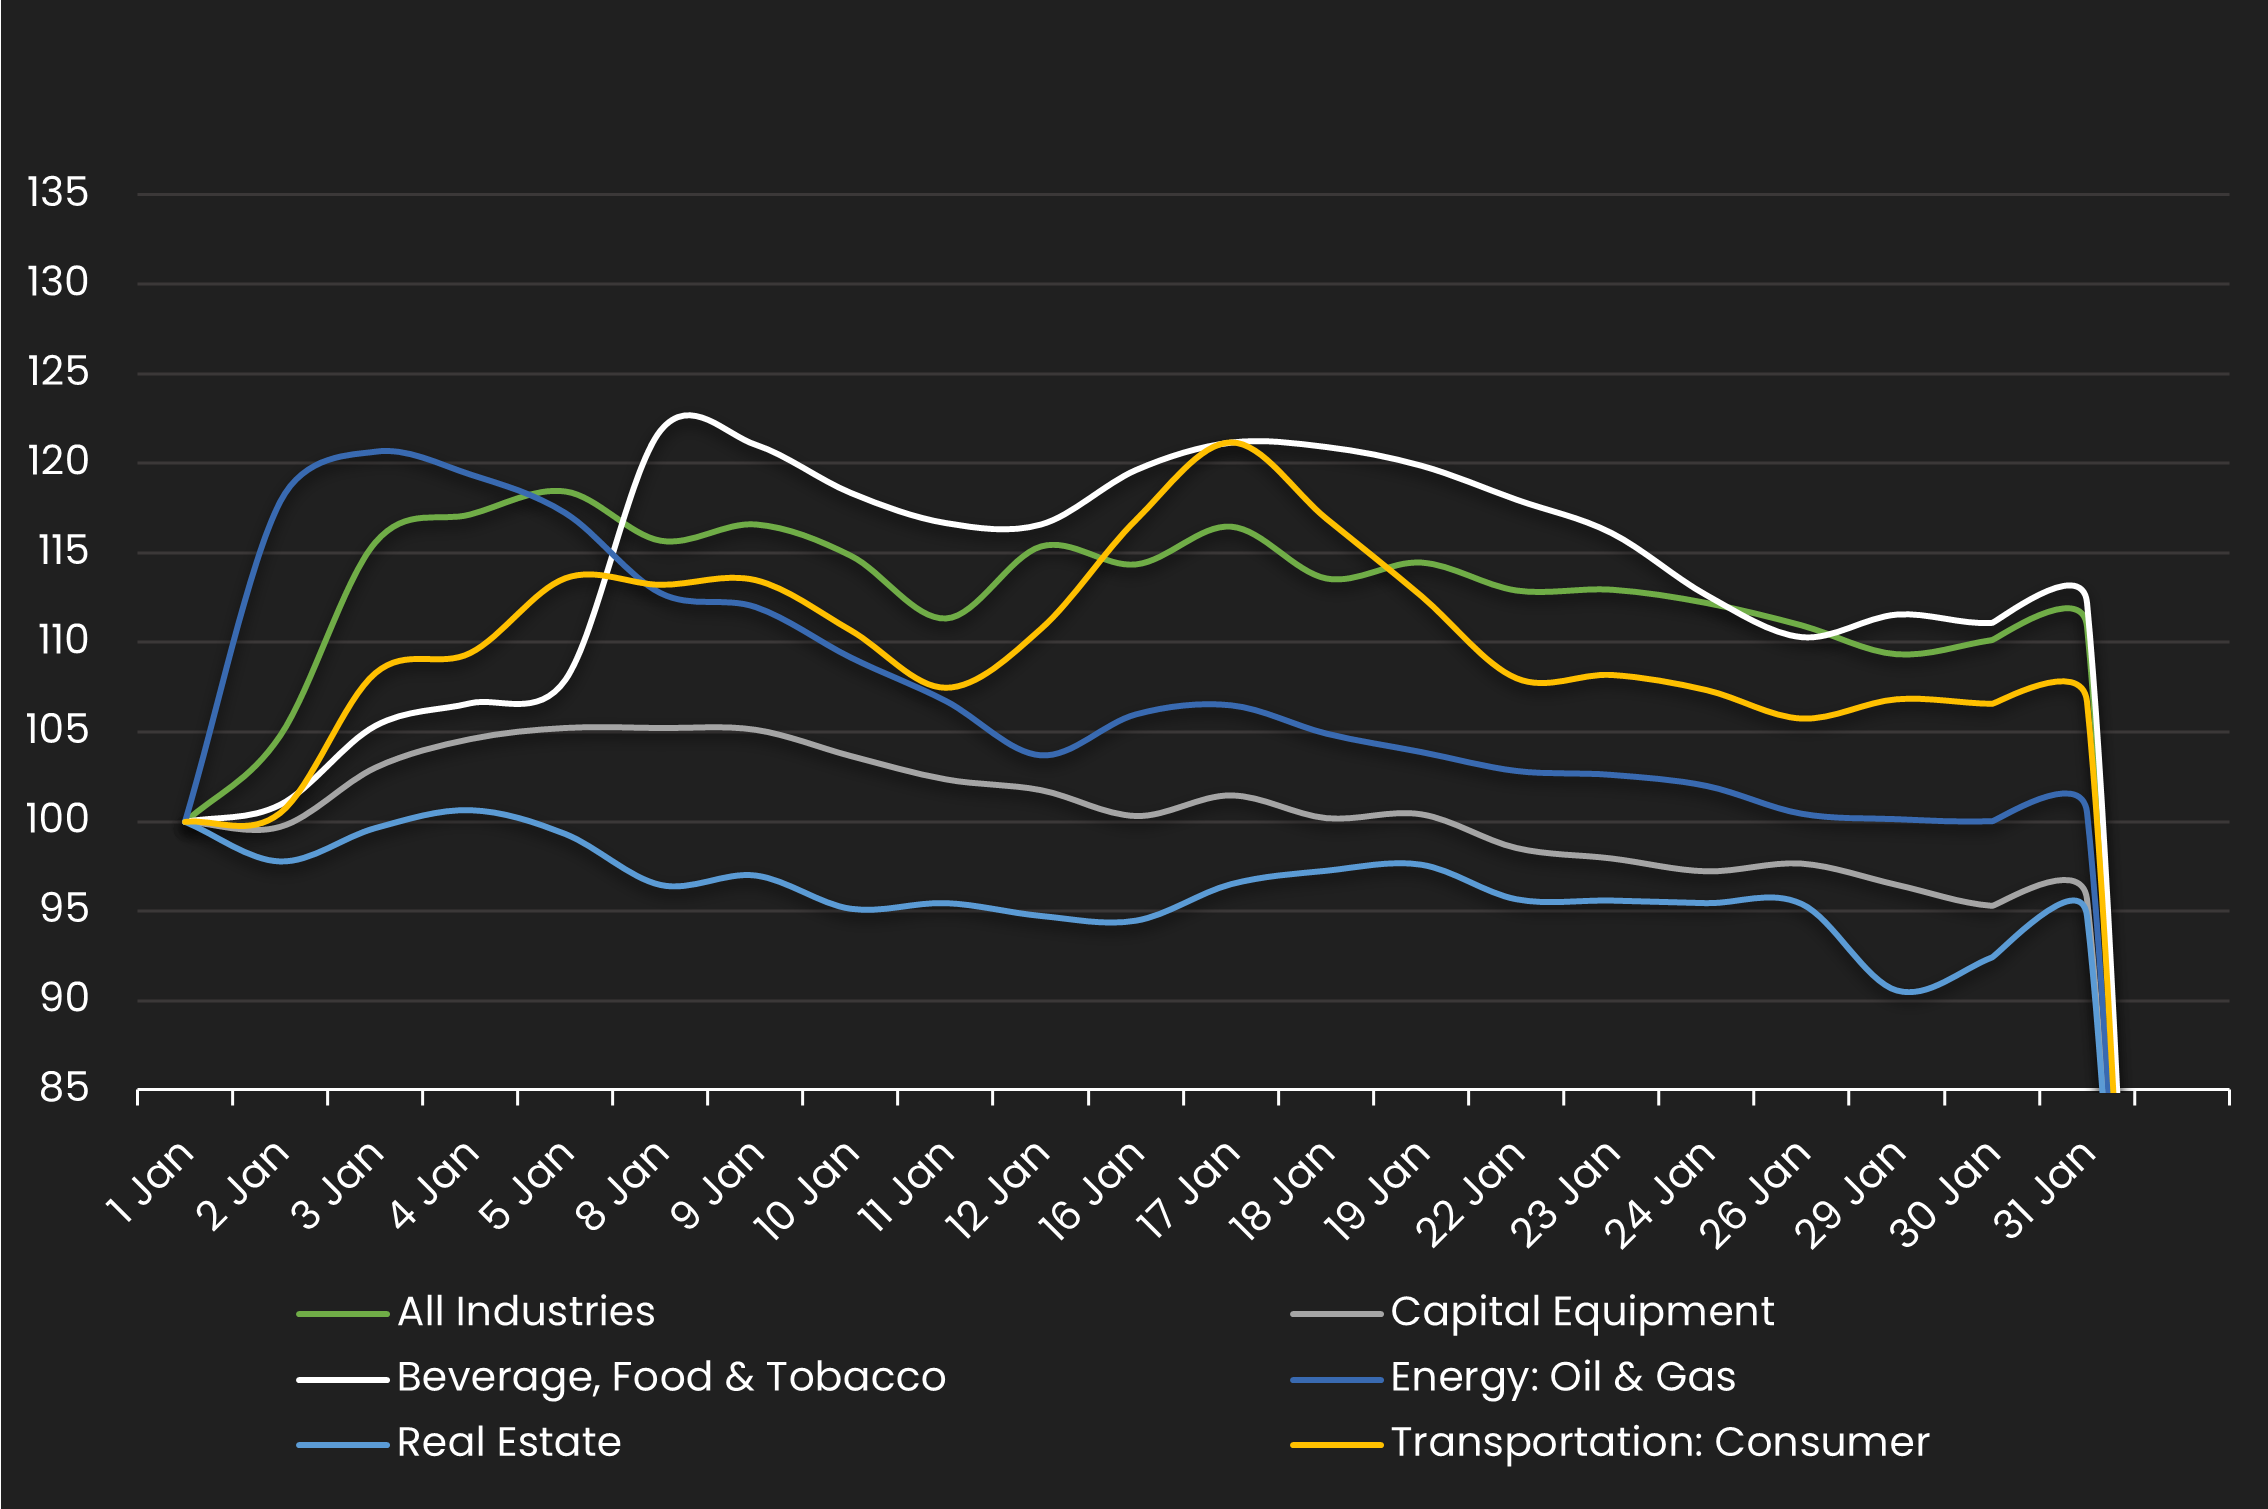
HY Spread by Industries – Monthly Comparison
Exhibits the HY spread by industry for the month ending 12/31/23 vs. the month ending 1/31/24
| INDUSTRIES | PREVIOUS SPREAD | CURRENT SPREAD | BPS CHANGE | MONTHLY PERFORMANCE | CDS COUNT |
|---|---|---|---|---|---|
| All Industries | 156 | 173 | 17 | Wider | 0 |
| Capital Equipment | 243 | 232 | -11 | Tighter | 0 |
| Beverage, Food & Tobacco | 158 | 178 | 19 | Wider | 0 |
| Energy: Oil & Gas | 124 | 125 | 1 | Wider | 0 |
| Real Estate | 161 | 153 | -9 | Tighter | 0 |
| Transportation: Consumer | 205 | 219 | 14 | Wider | 0 |
Stay up-to-date with monthly summaries.
Related Resources
About SOLVE
SOLVE is the leading market data platform provider for fixed-income securities, trusted by sophisticated buy-side and sell-side firms worldwide. Founded in 2011, SOLVE leverages its AI-driven technology and deep industry expertise to offer unparalleled transparency into markets, reduce risk, and save hundreds of hours across front-office workflows. With the largest real-time datasets for Securitized Products, Municipal Bonds, Corporate Bonds, Syndicated Bank Loans, Convertible Bonds, CDS, and Private Credit, SOLVE empowers clients to transform the way they bring new securities to market, trade on secondary markets, and value highly illiquid securities. Headquartered in Connecticut, with offices across the globe, SOLVE is the definitive source for market pricing in fixed-income markets.
