High Yield CDS Market Summary – February 2023
GET OUR CDS MARKET SUMMARIES STRAIGHT TO YOUR INBOX. LEARN MORE
High Yield CDS Market Summary: February 2023
Our newsletter presents key trends derived from observable Credit Default Swaps pricing data over a monthly period.
Top 10 Outperformers
Showcases the top 10 HY CDS “outperformers” based on the largest mid spread decreases between 2/1/23 – 2/28/23
| RANK | BOND NAME | ISSUER | % CHANGE | BPS CHANGE | SPRD | SPRD-1 MONTH |
|---|---|---|---|---|---|---|
| 1 | PHG 5Y | KONINKLIJKE PHILIPS ELECTRS | -24.4% | -25 | 78 | 102 |
| 2 | CAR 5Y | AVIS BUDGET CAR RENTAL LLC | -19.7% | -81 | 332 | 413 |
| 3 | ARM 5Y | ARVIN CAP I | -19.6% | -5 | 21 | 26 |
| 4 | AFKLM 5Y | AIR FRANCE-KLM | -19.5% | -108 | 446 | 554 |
| 5 | RAYAC 5Y | REXEL | -18.2% | -38 | 170 | 208 |
| 6 | IGT 5Y | INTERNATIONAL GAME TECHNOLOGY | -18.1% | -50 | 226 | 276 |
| 7 | THC 5Y | TENET HEALTHCARE CORP | -17.8% | -76 | 354 | 430 |
| 8 | SAIBV 5Y | SAIPEM FINANCE INTERNATIONAL BV | -17.2% | -88 | 423 | 511 |
| 9 | ROLLS 5Y | ROLLS ROYCE LTD | -16.6% | -50 | 249 | 299 |
| 10 | TITIM 5Y | TELECOM ITALIA SPA | -15.6% | -62 | 335 | 396 |
Top 10 Underperformers
Showcases the top 10 HY CDS “underperformers” based on the largest mid spread increases between 2/1/23 – 2/28/23
| RANK | BOND NAME | ISSUER | % CHANGE | BPS CHANGE | SPREAD | SPREAD-1 MONTH |
|---|---|---|---|---|---|---|
| 1 | ICBC 5Y | INDUSTRIAL & COML BK CHINA LTD | 32.5% | 21 | 84 | 63 |
| 2 | RMK 5Y | ARAMARK CORP | 32.0% | 53 | 217 | 164 |
| 3 | NSC 5Y | CONSOLIDATED RAIL CORP | 31.6% | 11 | 45 | 34 |
| 4 | INEGRP 5Y | INEOS FIN PLC | 30.9% | 72 | 304 | 232 |
| 5 | LPX 5Y | LP PINEWOOD SPV LLC | 29.6% | 32 | 140 | 108 |
| 6 | AMKR 5Y | AMKOR TECHNOLOGY INC | 28.4% | 41 | 185 | 144 |
| 7 | OXY 5Y | OCCIDENTAL PETE CORP | 26.2% | 30 | 143 | 113 |
| 8 | CITOH 5Y | LE SPORTSAC INC | 25.6% | 5 | 25 | 20 |
| 9 | LW 5Y | LAMB WESTON | 23.7% | 26 | 135 | 109 |
| 10 | AR 5Y | ANTERO RESOURCES CORP | 23.7% | 45 | 237 | 191 |
Normalized HY Spread by Region
Displays the HY CDS spread by region between 2/1/23 – 2/28/23 Results are based on 5 select regions, however, we offer data across 12 regions
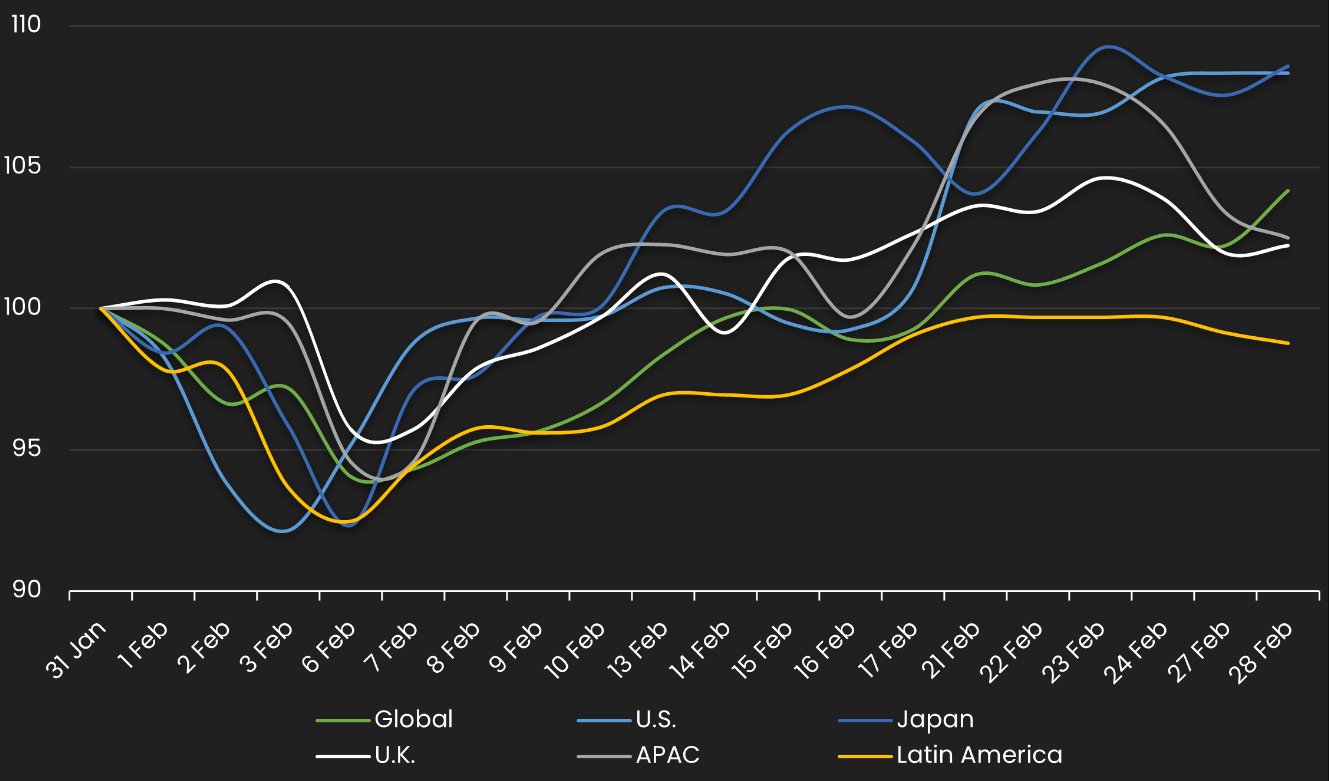
HY Spread by Region – Monthly Comparison
Exhibits the HY mid spread by region for the month ending 1/31/23 vs. the month ending 2/28/23
| REGION | PREVIOUS SPREAD | CURRENT SPREAD | BPS CHANGE | MONTHLY PERFORMANCE | CDS COUNT |
|---|---|---|---|---|---|
| Global | 153 | 159 | 6 | Wider | 255 |
| U.S. | 138 | 150 | 12 | Wider | 141 |
| Japan | 181 | 196 | 15 | Wider | 4 |
| U.K. | 108 | 111 | 2 | Wider | 17 |
| APAC | 110 | 113 | 3 | Wider | 5 |
| Latin America | 273 | 270 | -3 | Tighter | 8 |
Normalized HY Spread by Industry
Displays the HY CDS spread by industry between 2/1/23 – 2/28/23 Results are based on 5 select industry sectors, however, we offer data across 36 sectors
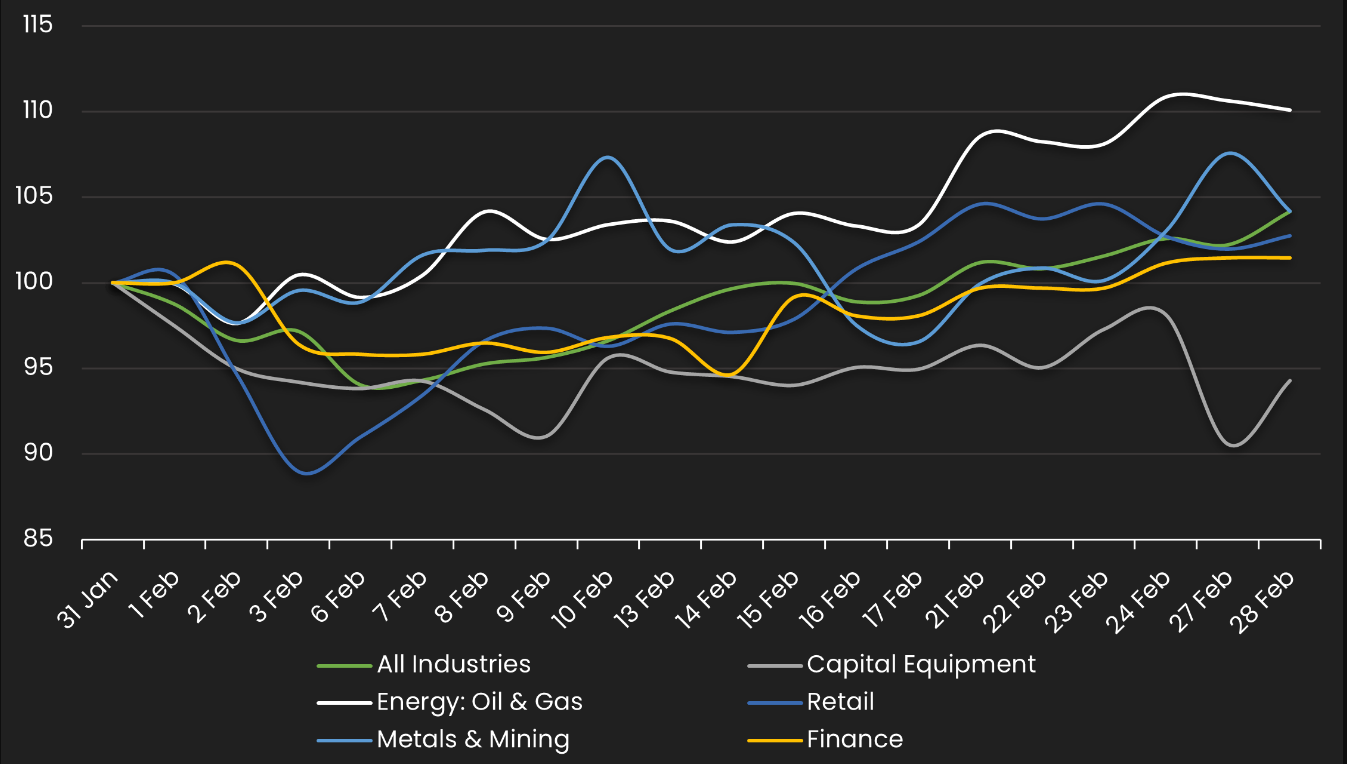
HY Spread by Industries – Monthly Comparison
Exhibits the HY spread by industry for the month ending 1/31/23 vs. the month ending 2/28/23
| INDUSTRIES | PREVIOUS SPREAD | CURRENT SPREAD | BPS CHANGE | MONTHLY PERFORMANCE | CDS COUNT |
|---|---|---|---|---|---|
| All Industries | 153 | 159 | 6 | Wider | 255.00 |
| Capital Equipment | 376 | 355 | -22 | Tighter | 6.00 |
| Energy: Oil & Gas | 112 | 123 | 11 | Wider | 17.00 |
| Retail | 143 | 147 | 4 | Wider | 11.00 |
| Metals & Mining | 135 | 140 | 6 | Wider | 9.00 |
| Finance | 119 | 121 | 2 | Wider | 24.00 |
Stay up-to-date with monthly summaries.
Related Resources
About SOLVE
SOLVE is the leading market data platform provider for fixed-income securities, trusted by sophisticated buy-side and sell-side firms worldwide. Founded in 2011, SOLVE leverages its AI-driven technology and deep industry expertise to offer unparalleled transparency into markets, reduce risk, and save hundreds of hours across front-office workflows. With the largest real-time datasets for Securitized Products, Municipal Bonds, Corporate Bonds, Syndicated Bank Loans, Convertible Bonds, CDS, and Private Credit, SOLVE empowers clients to transform the way they bring new securities to market, trade on secondary markets, and value highly illiquid securities. Headquartered in Connecticut, with offices across the globe, SOLVE is the definitive source for market pricing in fixed-income markets.
