High Yield CDS Market Summary – April 2025
GET OUR CDS MARKET SUMMARIES STRAIGHT TO YOUR INBOX. LEARN MORE
High Yield CDS Market Summary: April 2025
Our newsletter presents key trends derived from observable Credit Default Swaps pricing data over a monthly period.
Top 10 Outperformers
Showcases the top 10 HY CDS “outperformers” based on the largest mid spread decreases between 4/1/25 – 4/30/25
| RANK | BOND NAME | ISSUER | % CHANGE | BPS CHANGE | SPRD | SPRD-1 MONTH | DEALERS |
|---|---|---|---|---|---|---|---|
| 1 | NRG 5Y | NRG ENERGY INC | -18.4% | -26 | 115 | 140 | 3 |
| 2 | CSAL 5Y | COMMUNICATIONS SALES & LEASING INC | -17.5% | -52 | 245 | 296 | 3 |
| 3 | AMKR 5Y | AMKOR TECHNOLOGY INC | -17.3% | -25 | 121 | 146 | 3 |
| 4 | CALPINE 5Y | CALPINE CORP | -16.8% | -17 | 86 | 103 | 3 |
| 5 | LW 5Y | LAMB WESTON | -12.7% | -21 | 143 | 164 | 4 |
| 6 | THC 5Y | TENET HEALTHCARE CORP | -9.6% | -17 | 162 | 179 | 5 |
| 7 | TITIM 5Y | TELECOM ITALIA SPA | -9.6% | -17 | 161 | 178 | 3 |
| 8 | ELISS 5Y | ELIS SA | -8.1% | -8 | 96 | 104 | 3 |
| 9 | GPS 5Y | GAP INC | -7.2% | -14 | 180 | 194 | 3 |
| 10 | CCOH 5Y | CCO HOLDINGS LLC | -6.6% | -13 | 190 | 204 | 4 |
Top 10 Underperformers
Showcases the top 10 HY CDS “underperformers” based on the largest mid spread increases between 4/1/25 – 4/30/25
| RANK | BOND NAME | ISSUER | % CHANGE | BPS CHANGE | SPREAD | SPREAD-1 MONTH | DEALERS |
|---|---|---|---|---|---|---|---|
| 1 | MUR 5Y | MURPHY OIL CORP | 65.1% | 122 | 308 | 187 | 4 |
| 2 | AR 5Y | ANTERO RESOURCES CORP | 48.0% | 50 | 153 | 103 | 3 |
| 3 | NMAC 5Y | NISSAN MTR ACCEP CORP | 47.3% | 96 | 299 | 203 | 4 |
| 4 | NWL 5Y | NEWELL RUBBERMAID INC MEDIUM | 44.9% | 162 | 522 | 361 | 4 |
| 5 | BAB 5Y | BRITISH AIRWAYS | 41.5% | 44 | 150 | 106 | 3 |
| 6 | RAKUTN 5Y | RAKUTEN INC | 40.6% | 97 | 337 | 240 | 3 |
| 7 | TECHEM 5Y | TECHEM GMBH | 40.0% | 83 | 290 | 207 | 2 |
| 8 | OLN 5Y | OLIN CORP | 33.1% | 72 | 291 | 219 | 3 |
| 9 | BAIDU 5Y | BAIDU INC | 28.8% | 29 | 129 | 100 | 2 |
| 10 | ZFFNGR 5Y | ZF NA CAPITAL | 28.4% | 114 | 517 | 402 | 3 |
Normalized HY Spread by Region
Displays the HY CDS spread by region between 4/1/25 – 4/30/25 Results are based on 5 select regions, however, we offer data across 12 regions
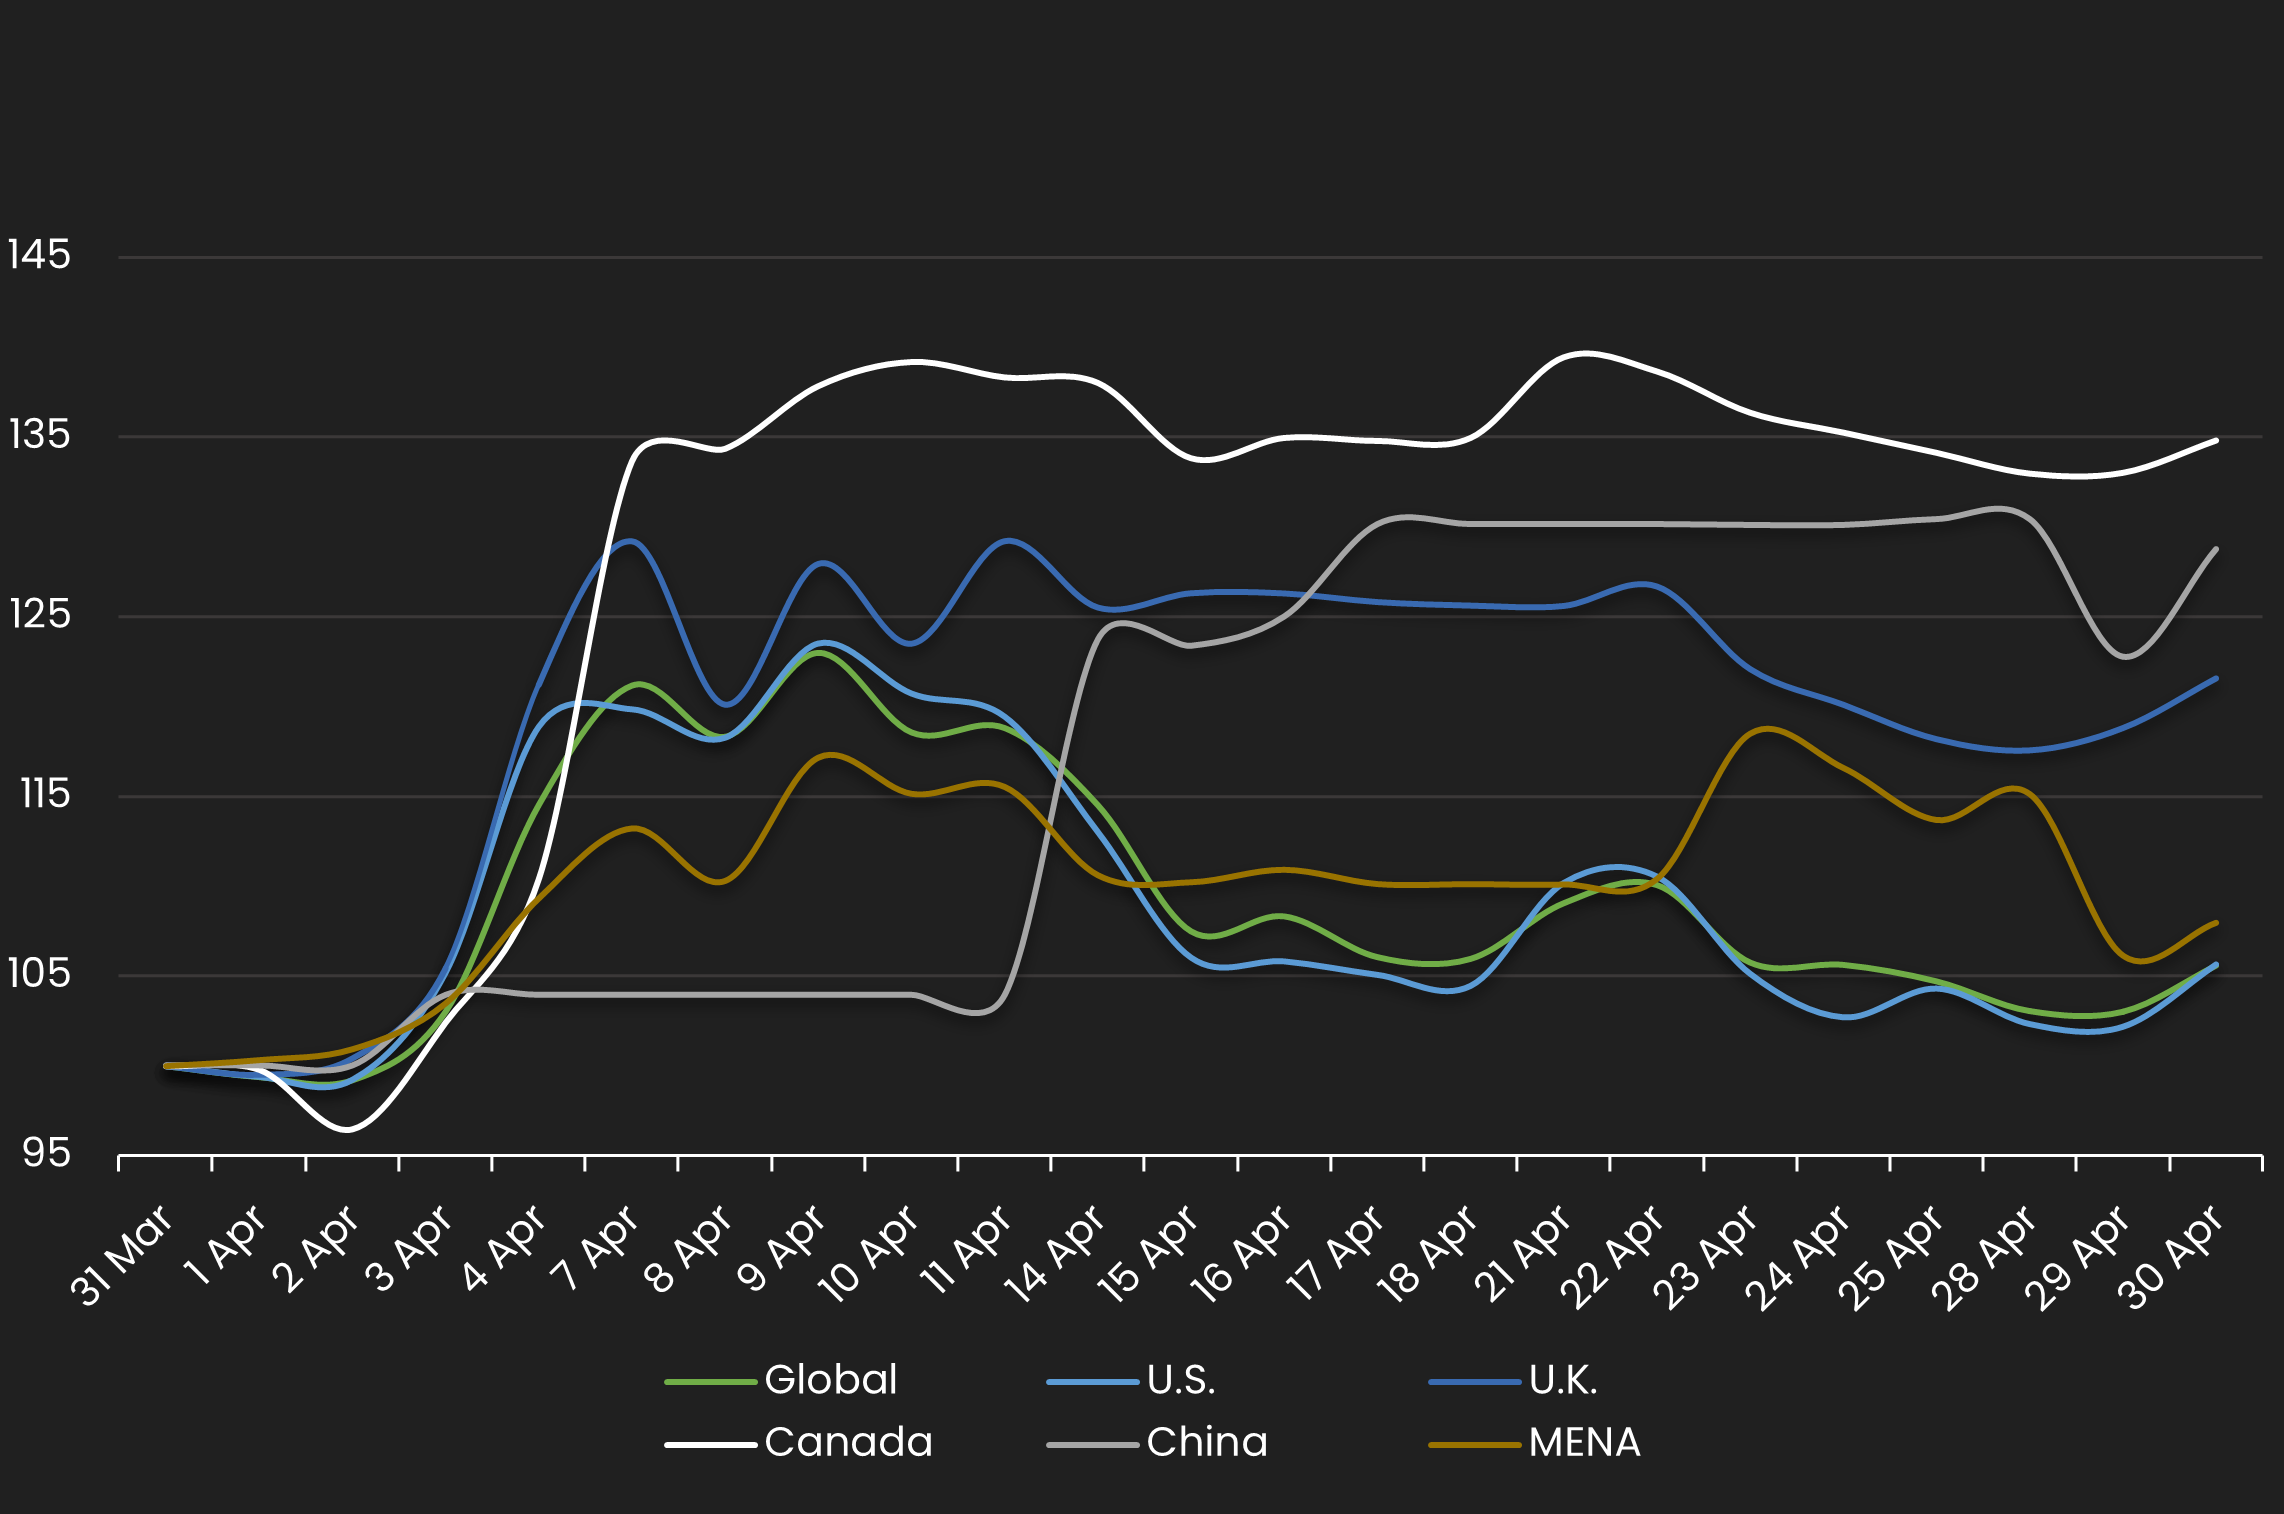
HY Spread by Region – Monthly Comparison
Exhibits the HY mid spread by region for the month ending 3/31/24 vs. the month ending 4/30/25
| REGION | PREVIOUS SPREAD | CURRENT SPREAD | BPS CHANGE | MONTHLY PERFORMANCE | CDS COUNT |
|---|---|---|---|---|---|
| Global | 165 | 174 | 9 | Wider | 184 |
| U.S. | 166 | 175 | 9 | Wider | 97 |
| U.K. | 133 | 162 | 29 | Wider | 16 |
| Canada | 82 | 110 | 28 | Wider | 2 |
| China | 100 | 129 | 29 | Wider | 1 |
| APAC | 108 | 121 | 13 | Wider | 1 |
Normalized HY Spread by Industry
Displays the HY CDS spread by industry between 4/1/25 – 4/30/25 Results are based on 5 select industry sectors, however, we offer data across 36 sectors
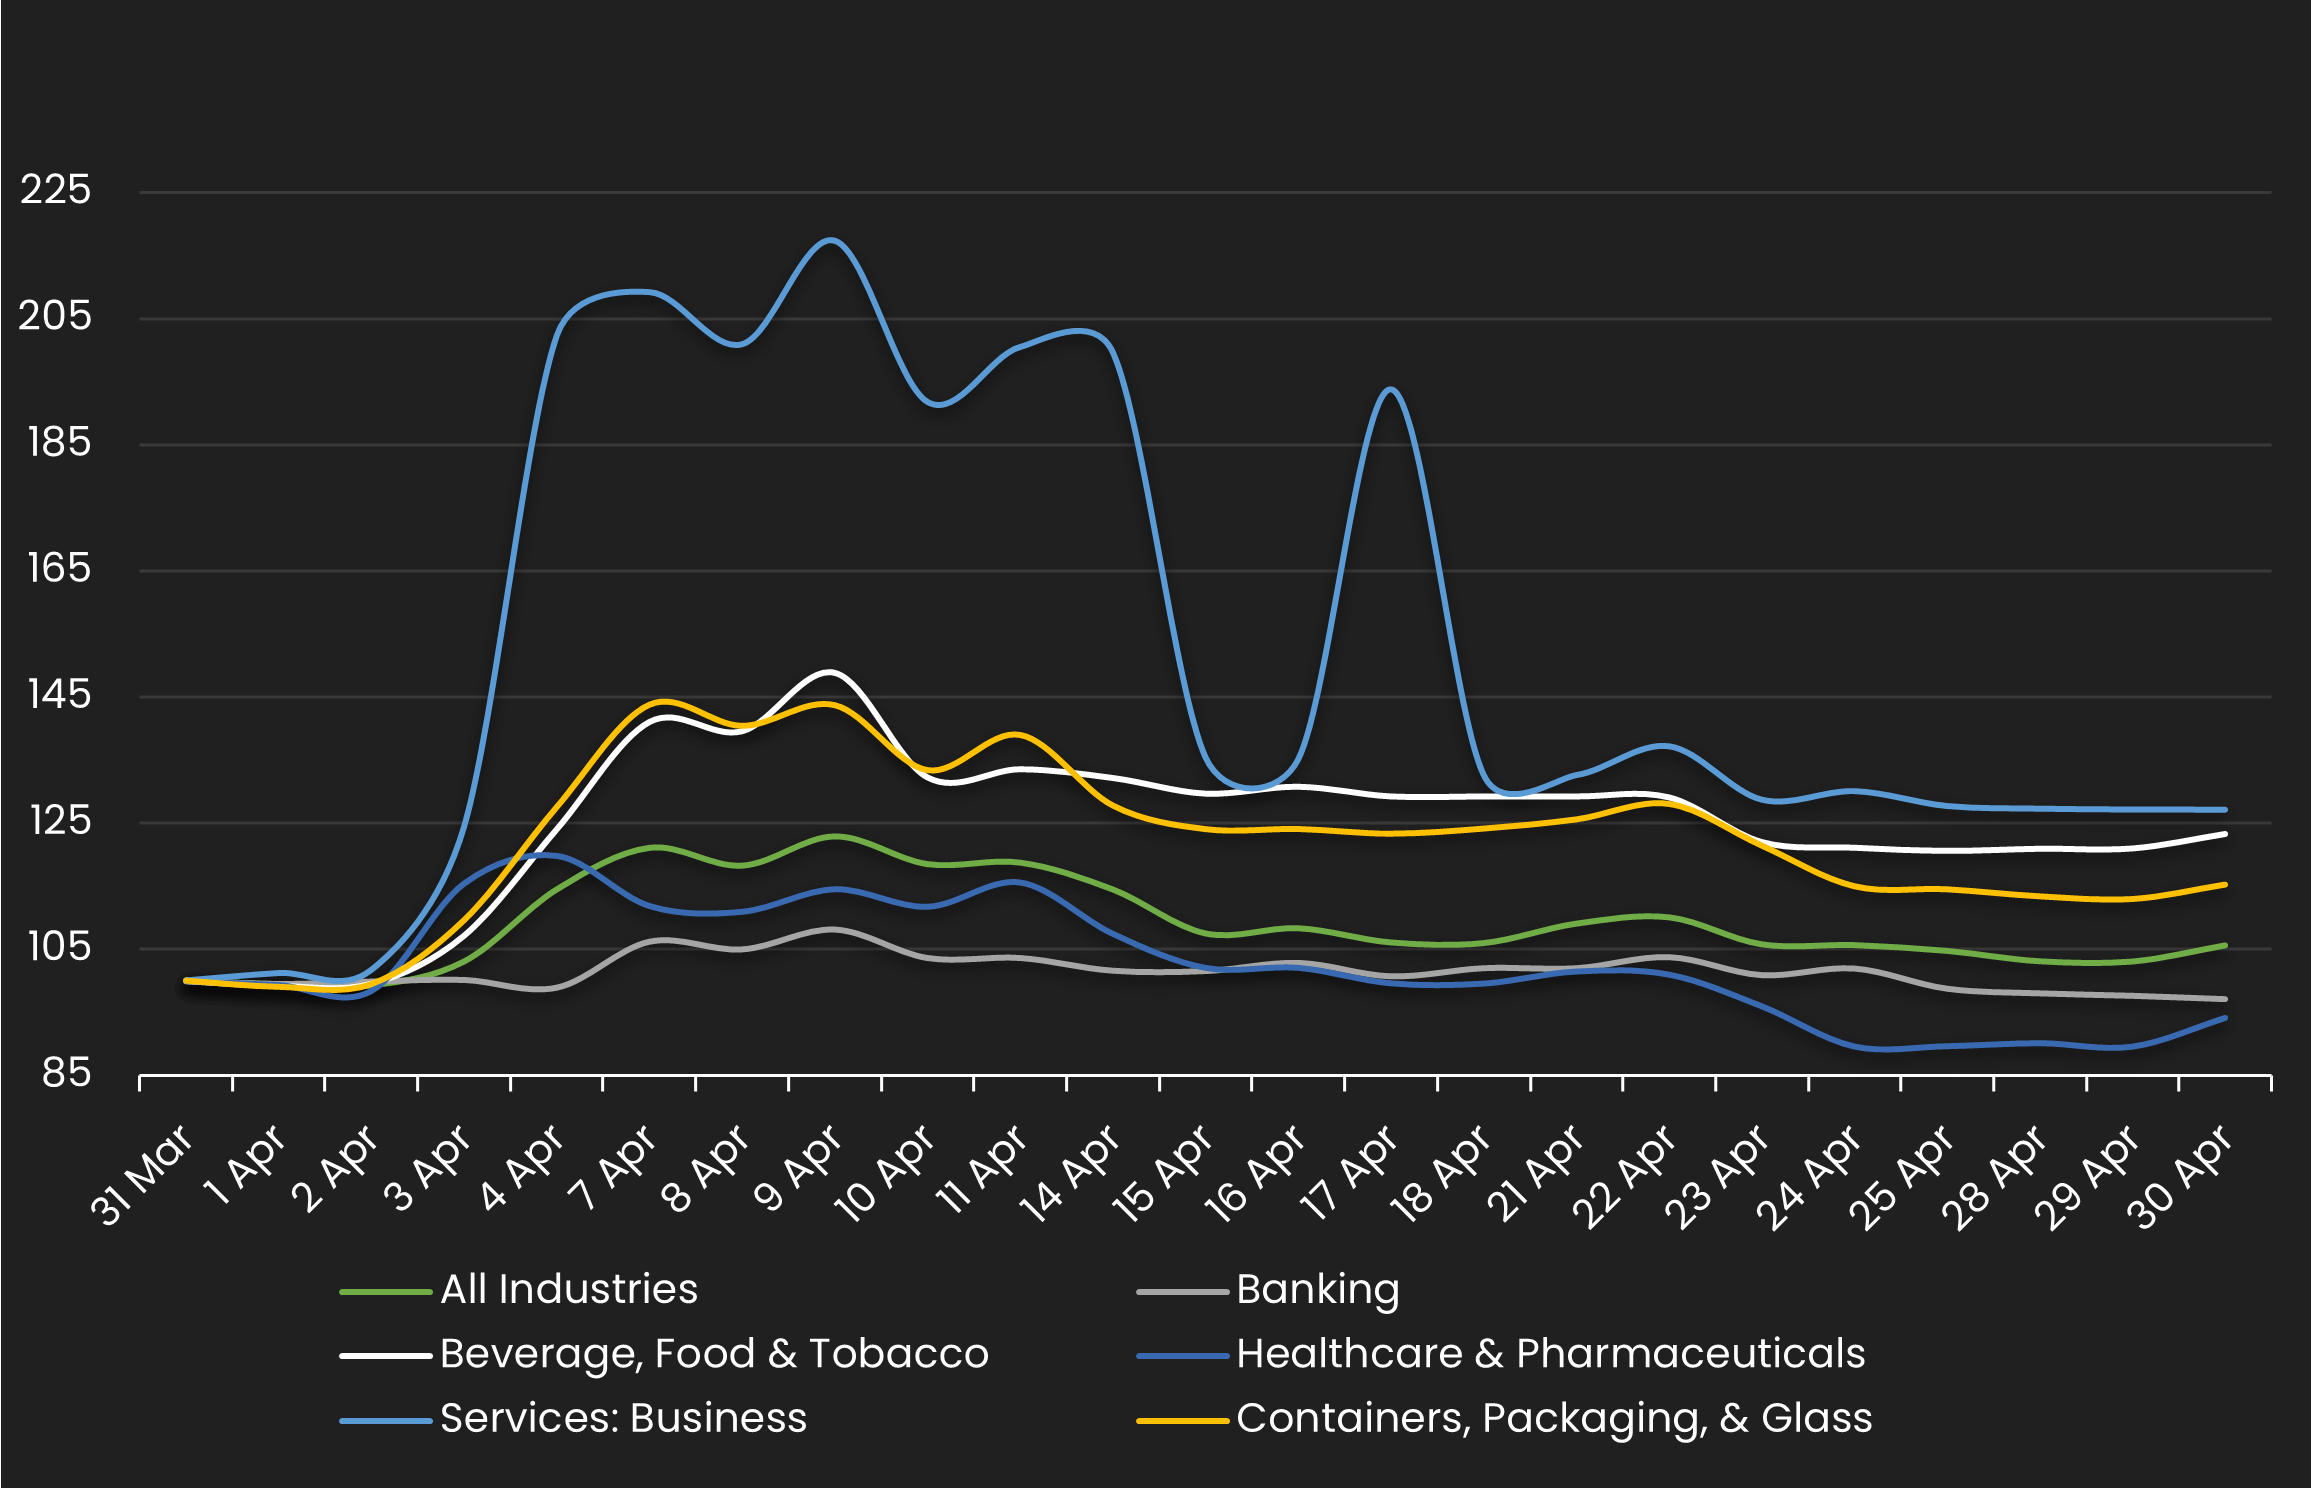
HY Spread by Industries – Monthly Comparison
Exhibits the HY spread by industry for the month ending 3/31/24 vs. the month ending 4/30/25
| INDUSTRIES | PREVIOUS SPREAD | CURRENT SPREAD | BPS CHANGE | MONTHLY PERFORMANCE | CDS COUNT |
|---|---|---|---|---|---|
| All Industries | 165 | 174 | 9 | Wider | 184.00 |
| Banking | 147 | 142 | -4 | Tighter | 4.00 |
| Beverage, Food & Tobacco | 208 | 256 | 48 | Wider | 7.00 |
| Healthcare & Pharmaceuticals | 166 | 157 | -10 | Tighter | 5.00 |
| Services: Business | 154 | 195 | 42 | Wider | 2.00 |
| Containers, Packaging, & Glass | 113 | 130 | 17 | Wider | 6.00 |
Stay up-to-date with monthly summaries.
Related Resources
About SOLVE
SOLVE is the leading market data platform provider for fixed-income securities, trusted by sophisticated buy-side and sell-side firms worldwide. Founded in 2011, SOLVE leverages its AI-driven technology and deep industry expertise to offer unparalleled transparency into markets, reduce risk, and save hundreds of hours across front-office workflows. With the largest real-time datasets for Securitized Products, Municipal Bonds, Corporate Bonds, Syndicated Bank Loans, Convertible Bonds, CDS, and Private Credit, SOLVE empowers clients to transform the way they bring new securities to market, trade on secondary markets, and value highly illiquid securities. Headquartered in Connecticut, with offices across the globe, SOLVE is the definitive source for market pricing in fixed-income markets.
