High Yield CDS Market Summary – April 2024
GET OUR CDS MARKET SUMMARIES STRAIGHT TO YOUR INBOX. LEARN MORE
High Yield CDS Market Summary: april 2024
Our newsletter presents key trends derived from observable Credit Default Swaps pricing data over a monthly period.
Top 10 Outperformers
Showcases the top 10 HY CDS “outperformers” based on the largest mid spread decreases between 4/1/24 – 4/30/24
| RANK | BOND NAME | ISSUER | % CHANGE | BPS CHANGE | SPRD | SPRD-1 MONTH | DEALERS |
|---|---|---|---|---|---|---|---|
| 1 | BANSAB 5Y | TRANSATLANTIC BK MIAMI FLA | -28.2% | -30 | 77 | 107 | 2 |
| 2 | NVFVES 5Y | NOVAFIVES SAS | -19.6% | -56 | 231 | 287 | 3 |
| 3 | AR 5Y | ANTERO RESOURCES CORP | -15.7% | -17 | 91 | 107 | 6 |
| 4 | SCFER 5Y | SCHAEFFLER FINANCE BV | -15.4% | -23 | 129 | 152 | 2 |
| 5 | HPLGR 5Y | HAPAG-LLOYD A G | -13.1% | -35 | 230 | 265 | 3 |
| 6 | MUR 5Y | MURPHY OIL CORP | -12.2% | -14 | 100 | 114 | 6 |
| 7 | BOMB 5Y | BOMBARDIER CAP TR | -12.1% | -31 | 229 | 260 | 3 |
| 8 | TEVA 5Y | TEVA PHARMACEUTICAL INDUSTRIES LTD | -9.0% | -14 | 140 | 154 | 4 |
| 9 | CMACG 5Y | CMA CGM S A | -7.9% | -19 | 216 | 235 | 3 |
| 10 | GFKLDE 5Y | LOWELL HOLDINGS GMBH | -7.0% | -8 | 111 | 120 | 2 |
Top 10 Underperformers
Showcases the top 10 HY CDS “underperformers” based on the largest mid spread increases between 4/1/24 – 4/30/24
| RANK | BOND NAME | ISSUER | % CHANGE | BPS CHANGE | SPREAD | SPREAD-1 MONTH | DEALERS |
|---|---|---|---|---|---|---|---|
| 1 | NAVI 5Y | SLM CORP MEDIUM TERM NTS BOOK | 37.2% | 94 | 348 | 254 | 5 |
| 2 | IGTLN 5Y | INTERNATIONAL GAMING TECHNOLOGY PLC | 34.3% | 40 | 155 | 115 | 3 |
| 3 | NIDHEA 5Y | STADA ARZNEIMITTEL AG | 33.9% | 44 | 175 | 131 | 3 |
| 4 | IGT 5Y | INTERNATIONAL GAME TECHNOLOGY | 32.5% | 38 | 156 | 118 | 2 |
| 5 | CAR 5Y | AVIS BUDGET CAR RENTAL LLC | 26.6% | 97 | 463 | 366 | 4 |
| 6 | TITIM 5Y | TELECOM ITALIA SPA | 26.1% | 56 | 273 | 216 | 5 |
| 7 | LHAGR 5Y | DEUTSCHE LUFTHANSA AG | 24.4% | 26 | 133 | 106 | 5 |
| 8 | UPC 5Y | UPC HOLDING BV | 24.3% | 51 | 261 | 210 | 4 |
| 9 | GPS 5Y | GAP INC | 23.0% | 40 | 213 | 173 | 5 |
| 10 | XRX 5Y | XEROX BUSINESS SERVICES LLC | 19.1% | 60 | 376 | 316 | 5 |
Normalized HY Spread by Region
Displays the HY CDS spread by region between 4/1/24 – 4/30/24 Results are based on 5 select regions, however, we offer data across 12 regions
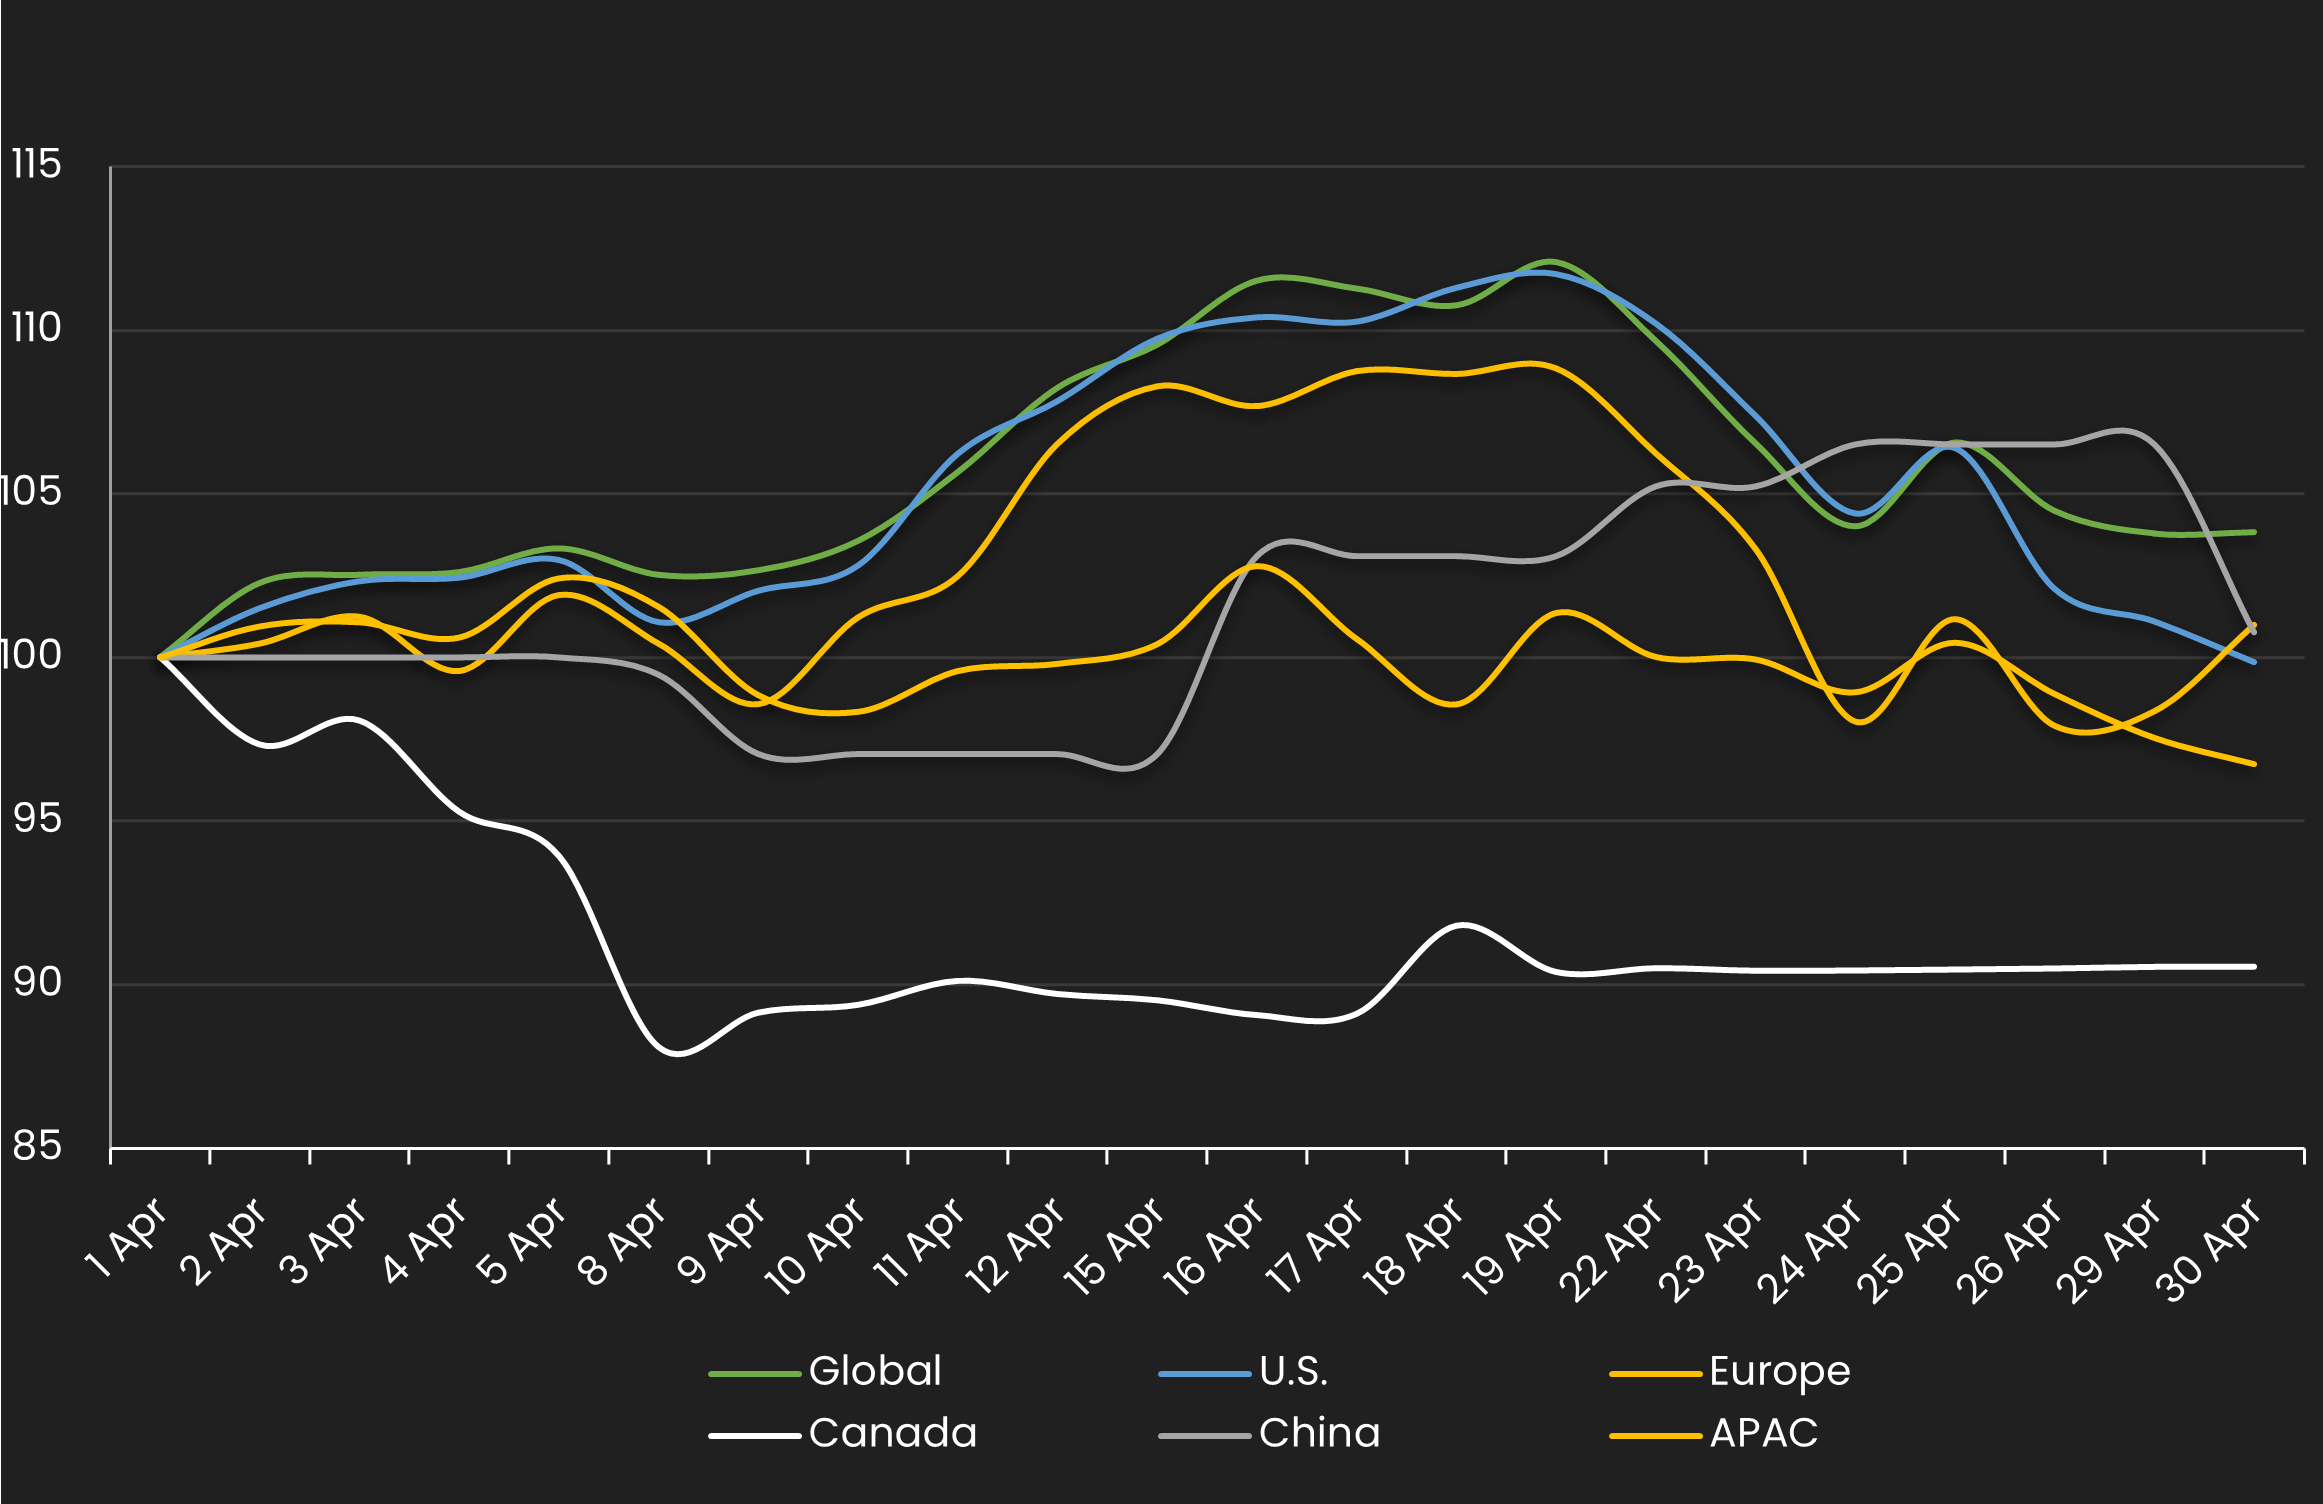
HY Spread by Region – Monthly Comparison
Exhibits the HY mid spread by region for the month ending 3/31/24 vs. the month ending 4/30/24
| REGION | PREVIOUS SPREAD | CURRENT SPREAD | BPS CHANGE | MONTHLY PERFORMANCE | CDS COUNT |
|---|---|---|---|---|---|
| Global | 141 | 147 | 5 | Wider | 178 |
| U.S. | 141 | 141 | 0 | Tighter | 94 |
| Europe | 153 | 155 | 2 | Wider | 49 |
| Canada | 188 | 170 | -18 | Tighter | 4 |
| China | 82 | 83 | 1 | Wider | 1 |
| APAC | 122 | 118 | -4 | Tighter | 1 |
Normalized HY Spread by Industry
Displays the HY CDS spread by industry between 4/1/24 – 4/30/24 Results are based on 5 select industry sectors, however, we offer data across 36 sectors
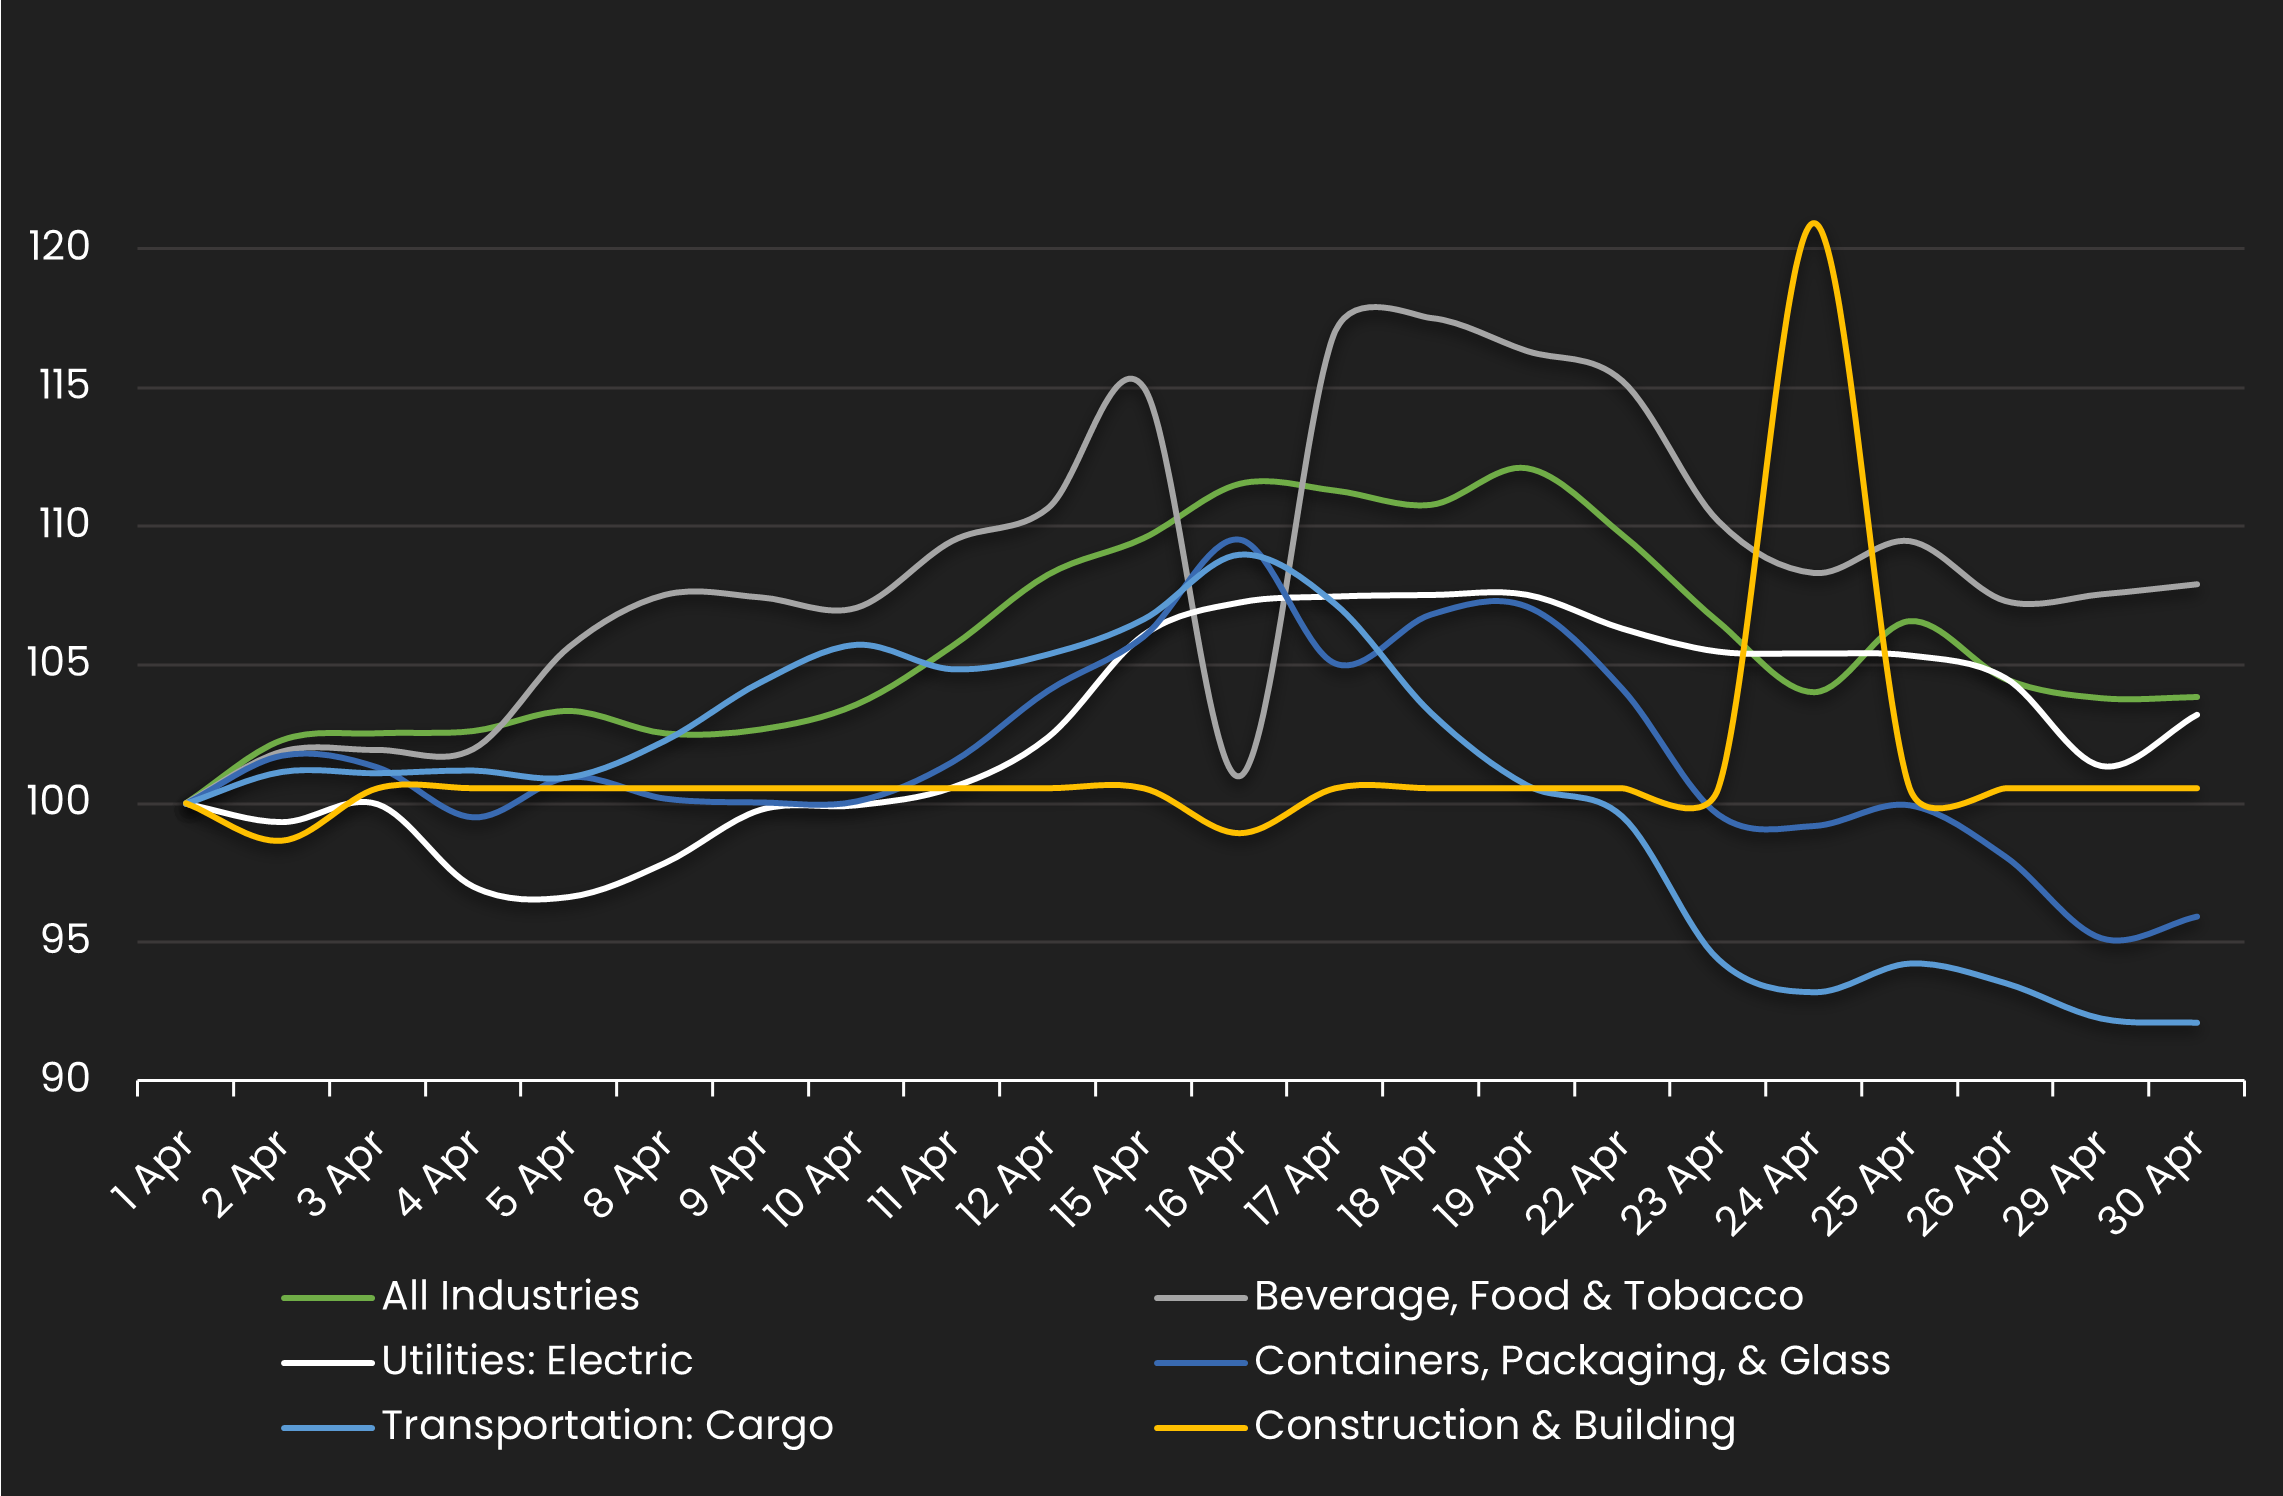
HY Spread by Industries – Monthly Comparison
Exhibits the HY spread by industry for the month ending 3/31/24 vs. the month ending 4/30/24
| INDUSTRIES | PREVIOUS SPREAD | CURRENT SPREAD | BPS CHANGE | MONTHLY PERFORMANCE | CDS COUNT |
|---|---|---|---|---|---|
| All Industries | 141 | 147 | 5 | Wider | 178.00 |
| Beverage, Food & Tobacco | 171 | 185 | 14 | Wider | 5.00 |
| Utilities: Electric | 125 | 129 | 4 | Wider | 6.00 |
| Containers, Packaging, & Glass | 99 | 95 | -4 | Tighter | 6.00 |
| Transportation: Cargo | 235 | 216 | -19 | Tighter | 3.00 |
| Construction & Building | 185 | 186 | 1 | Wider | 5.00 |
Stay up-to-date with monthly summaries.
Related Resources
About SOLVE
SOLVE is the leading market data platform provider for fixed-income securities, trusted by sophisticated buy-side and sell-side firms worldwide. Founded in 2011, SOLVE leverages its AI-driven technology and deep industry expertise to offer unparalleled transparency into markets, reduce risk, and save hundreds of hours across front-office workflows. With the largest real-time datasets for Securitized Products, Municipal Bonds, Corporate Bonds, Syndicated Bank Loans, Convertible Bonds, CDS, and Private Credit, SOLVE empowers clients to transform the way they bring new securities to market, trade on secondary markets, and value highly illiquid securities. Headquartered in Connecticut, with offices across the globe, SOLVE is the definitive source for market pricing in fixed-income markets.
