BDC Filing Season: Week Ended February 17, 2023
BDC Filing Season Q4 2022
BDC data provided by the Advantage Data Workstation, a SOLVE product. For more information about our BDC data or our other products please contact marketpluse@solveadvisors.com.
Filing Recap
BDC Filing season is in full swing. This report will analyze the 7 BDCs that filed last week. Aggregate Fair Value reported by these BDCs is 8.7 Billion USD which is approximately 3.40% of aggregate AUM of all BDCs.
| Name | Number of Investmets | % Portfolio | Cost | % Gain/Loss | Principal Value | Fair Value | FV Yield | Filtered Yield | Cost Yield | ||||||||
|---|---|---|---|---|---|---|---|---|---|---|---|---|---|---|---|---|---|
| Hercules Capital Inc. | 339 | 100.00% | 3,005,696 | -1.389 | 2,825,777 | 2,963,955 | 10.92 | 10.61 | 10.73 | ||||||||
| Sixth Street Specialty Lending, Inc. | 176 | 100.00% | 2,774,726 | 0.476 | 2,690,611 | 2,787,925 | 15.79 | 12.44 | 12.76 | ||||||||
| Golub Capital BDC 3 Inc. | 1,302 | 100.00% | 2,448,316 | -1.443 | 2,332,122 | 2,412,983 | 10.8 | 10.77 | 10.36 | ||||||||
| Golub Capital Direct Lending Corp | 418 | 100.00% | 248,216 | -1.266 | 237,799 | 245,074 | 10.88 | 10.87 | 10.56 | ||||||||
| Investcorp Credit Management BDC Inc. | 61 | 100.00% | 274,888 | -16.841 | 251,357 | 228,594 | 14 | 11.92 | 12.68 | ||||||||
| Prospect Floating Rate & Alternative Income Fund, Inc. | 45 | 100.00% | 36,335 | -11.331 | 39,205 | 32,218 | 16.34 | 10.2 | 13.9 | ||||||||
| Wellings Real Estate Income Fund | 10 | 100.00% | 16,950 | 0.695 | — | 17,068 | — | — | — | ||||||||
| TOTAL | 2,351 | 100.00% | 8,805,127 | -1.33% | 8,376,870 | 8,687,816 | 12.63 | 11.31 | 11.36 | ||||||||
Non-Accruals
At least 4 BDCs that filed last week have reported Non–Accruals amounting to 54.4 Million USD at Cost. Investcorp Credit Management BDC Inc. and Golub Capital BDC 3 Inc. are leading the Non-Accruals list.
| Name | Number of Investments | % Portfolio | Cost | % Gain/Loss | Principal Value | Fair Value | FV Yield | Filtered Yield | Cost Yield | ||||||||
|---|---|---|---|---|---|---|---|---|---|---|---|---|---|---|---|---|---|
| Investcorp Credit Management BDC Inc. | 7 | 1.30% | 36,815 | -91.554 | 37,199 | 3,109 | — | — | 9.64 | ||||||||
| Golub Capital BDC 3 Inc. | 3 | 0.09% | 2,451 | -17.789 | 2,467 | 2,015 | 18.65 | — | 10.23 | ||||||||
| Sixth Street Specialty Lending, Inc. | 2 | 0.01% | 1,909 | -91.985 | 6,104 | 153 | 1,369.30 | — | 155.58 | ||||||||
| Hercules Capital Inc. | 2 | 0.00% | 13,263 | -99.487 | 23,703 | 68 | — | — | — | ||||||||
| TOTAL | 14 | 0.06% | 54,438 | -90.18% | 69,473 | 5,345 | 0 | 0 | 56.39 | ||||||||
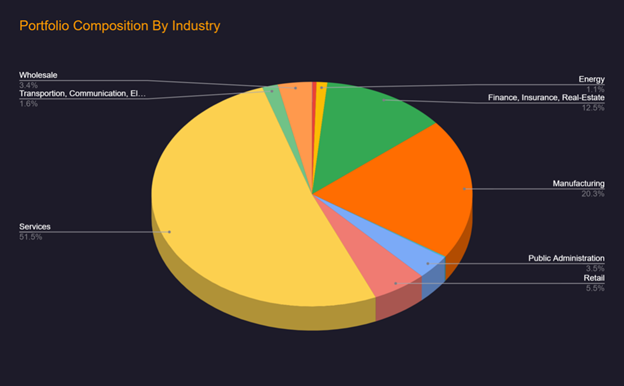
Portfolio Composition By Industry
The chart below is an overall view of the BDC’s aggregate Industry Diversification.
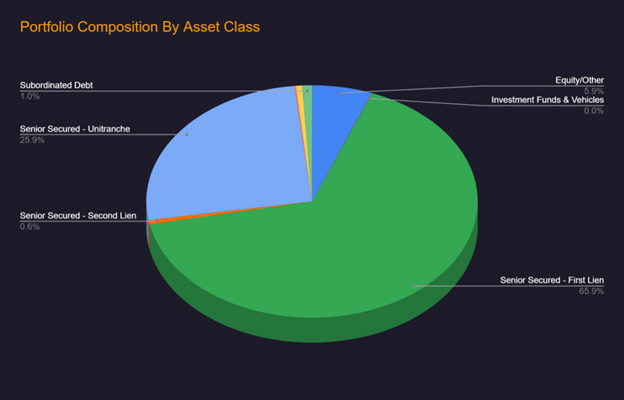
Portfolio Composition By Asset Class
The chart below is a bird’s-eye view of the BDC’s aggregate Diversification by Asset Class.
BDC Investments Maturing in the next 12 Months
The table below summarizes aggregate investments of BDCs that are maturing in the next 12 months, which combined are worth more than 371.1 Million USD at cost.
| BDC | Cost (1000) | FV (1000) |
|---|---|---|
| Hercules Capital Inc. | 166,792 | 166,395 |
| Sixth Street Specialty Lending, Inc. | 131,319 | 134,468 |
| Golub Capital BDC 3 Inc. | 46,225 | 41,109 |
| Investcorp Credit Management BDC Inc. | 25,806 | 16,398 |
| Prospect Floating Rate & Alternative Income Fund, Inc. | 956 | 664 |
| Golub Capital Direct Lending Corp | 6 | 6 |
| Grand Total | 371,104 | 359,040 |
Top 10 BDC Investments
BDC’s portfolio quality can be measured by taking a deeper dive into the BDC’s top 10 investments. While these investments are small in number, they are the primary determinant of a BDC’s portfolio performance. Top 10 Investments of BDC’s that filed last week amount to 12.7 Billion USD (Cost) accounting for 28.1% of their aggregate holdings (Cost).
| BDC | Cost (1000) | FV (1000) |
|---|---|---|
| Hercules Capital Inc. | 851,875 | 858,364 |
| Sixth Street Specialty Lending, Inc. | 673,506 | 683,381 |
| Golub Capital BDC 3 Inc. | 403,191 | 399,693 |
| Investcorp Credit Management BDC Inc. | 100,556 | 99,345 |
| Golub Capital Direct Lending Corp | 95,899 | 95,189 |
| Prospect Floating Rate & Alternative Income Fund, Inc. | 19,207 | 18,120 |
| Wellings Real Estate Income Fund | 16,950 | 17,068 |
| Grand Total | 2,161,184 | 2,171,160 |
Source: The BDC Advantage, Advantage Data Inc., Copyright © 2023.Redistribution Strictly Prohibited. Data can not be used in any way to populate a database nor shared with unauthorized users. See ADI Terms. All rights reserved. +1 (617) 261 9700.
BDC Filing Season Recaps are written by Sourav Srimal, Nikhil Thadaney, Andrew Robartes, and Nayan Raj. For more information about our BDC data or our other products please contact marketpluse@solveadvisors.com.
Sourav Srimal
Senior Vice President
ssrimal@solveadvisors.com
Nikhil Thadaney
Data Analyst
nthadaney@solveadvisors.com
Andrew Robartes
Data Analyst
arobartes@solveadvisors.com
Nayan Raj
Data Analyst
nraj@solveadvisors.com
Stay up-to-date with weekly summaries.
Related Resources
About SOLVE
SOLVE is the leading market data platform provider for fixed-income securities, trusted by sophisticated buy-side and sell-side firms worldwide. Founded in 2011, SOLVE leverages its AI-driven technology and deep industry expertise to offer unparalleled transparency into markets, reduce risk, and save hundreds of hours across front-office workflows. With the largest real-time datasets for Securitized Products, Municipal Bonds, Corporate Bonds, Syndicated Bank Loans, Convertible Bonds, CDS, and Private Credit, SOLVE empowers clients to transform the way they bring new securities to market, trade on secondary markets, and value highly illiquid securities. Headquartered in Connecticut, with offices across the globe, SOLVE is the definitive source for market pricing in fixed-income markets.
