Syndicated Bank Loan Market Summary – Week Ending 3/28/25
GET OUR BANK LOAN MARKET SUMMARIES STRAIGHT TO YOUR INBOX. LEARN MORE
Syndicated Bank Loan Market Summary: Week Ending 3/28/25
Our newsletter presents key trends derived from observable Syndicated Bank Loan pricing data over a weekly period.
New Issues
Loans issued during the week ending 3/28/25
| ISSUER | AMOUNT (MM) | LOAN TYPE | MATURITY | RATE |
|---|---|---|---|---|
| Jacobs Engineering Group Inc. | 410 | Term Loan | 3/27/2027 | SN+87.5 |
| Dollar Tree Stores Inc. | 1500 | Revolving Credit | 3/21/2030 | S+112.5 |
| Brookfield Properties Pty LTD | 885 | Term Loan | 3/27/2030 | S+275 |
forward calendar
Forward calendar during the week ending 3/28/25
| Issuer | Deal Information | Banks | Expected Issue Date |
|---|---|---|---|
| Chase Corp. | $550MM credit facilities | BMO,STD,NTXS,SC | Q2 2025 |
| Murphy Oil USA Inc. | $600MM TLB (BBB-) | RBC | Q2 2025 |
Largest Loans
Highlights the weekly price movements and quote depth for the 20 largest bank loans between 3/21/25-3/28/25
| RANK | SIZE (MM) | NAME | CHANGE | PRC | PRC-1W | DEALERS |
|---|---|---|---|---|---|---|
| 1 | 7,631 | MEDLINE TL | -0.02% | 99.88 | 99.90 | 14 |
| 2 | 6,145 | MAGNOLIA TL | -0.45% | 89.22 | 89.62 | 13 |
| 3 | 4,750 | ZAYO TL | 0.15% | 93.45 | 93.30 | 14 |
| 4 | 4,741 | INTERNET BRANDS TL B | 0.39% | 94.44 | 94.08 | 13 |
| 5 | 4,525 | TRANSDIGM INC. TL I | 0.09% | 100.01 | 99.92 | 17 |
| 6 | 4,479 | TIBCO TL B | 0.00% | 99.23 | 99.23 | 13 |
| 7 | 4,226 | INSPIRE BRANDS TL B | 0.08% | 99.48 | 99.39 | 15 |
| 8 | 4,204 | JANE STREET TL B | 0.20% | 99.12 | 98.92 | 17 |
| 9 | 4,001 | CITADEL TL B | 0.05% | 99.98 | 99.92 | 15 |
| 10 | 3,935 | SS&C TECH TL B8 | 0.06% | 99.97 | 99.91 | 18 |
| 11 | 3,900 | DIRECTV HLDGS LLC / DIRECTV TL | -0.07% | 100.01 | 100.09 | 10 |
| 12 | 3,859 | ALLIANT HLDGS I INC TL B | 0.04% | 99.46 | 99.42 | 20 |
| 13 | 3,640 | TRANSDIGM INC. TL J | 0.01% | 99.49 | 99.48 | 17 |
| 14 | 3,573 | CDK GLOBAL TL B | 0.15% | 86.50 | 86.37 | 16 |
| 15 | 3,566 | AIR MEDICAL PIK TL B | 0.35% | 100.04 | 99.70 | 11 |
| 16 | 3,500 | AMERICAN AIRLINES TL B | 0.18% | 101.94 | 101.76 | 13 |
| 17 | 3,420 | RCN GRANDE TL | 1.70% | 85.89 | 84.46 | 13 |
| 18 | 3,393 | GENESYS TELECOM TL B | 0.01% | 99.13 | 99.12 | 10 |
| 19 | 3,380 | SOLERA TL B | 0.33% | 95.59 | 95.28 | 17 |
| 20 | 3,340 | PROOFPOINT TL B | 0.18% | 99.85 | 99.67 | 12 |
| AVERAGE | 4,210 | 0.17% | 97.13 | 97.55 | 14.4 |
Top 10 Performers
Showcases the top 10 loan performers based on the largest bid price increases between 3/21/25-3/28/25
| RANK | NAME | CHANGE | PRC | PRC-1W | DEALERS |
|---|---|---|---|---|---|
| 1 | SITEL LLC / SITEL FIN CORP TL B | 8.60% | 60.67 | 55.87 | 16 |
| 2 | PETCO TL B | 5.87% | 91.98 | 86.89 | 15 |
| 3 | MICHAELS STORES TL | 3.54% | 74.16 | 71.63 | 16 |
| 4 | AMERICAN BATH TL | 3.10% | 92.76 | 89.96 | 14 |
| 5 | FOUNDATION BUILDING TL | 2.18% | 94.95 | 92.92 | 14 |
| 6 | CRASH CHAMPIONS LLC TL B | 2.09% | 89.64 | 87.81 | 10 |
| 7 | VIASAT INC TL | 1.82% | 91.69 | 90.05 | 9 |
| 8 | DUFF & PHELPS TL B | 1.79% | 94.85 | 93.18 | 14 |
| 9 | US LBM TL B | 1.39% | 92.33 | 91.06 | 14 |
| 10 | LIFEPOINT HOSPITALS TL B | 1.32% | 96.82 | 95.55 | 11 |
Bottom 10 Perfromers
Showcases the bottom 10 loan performers based on the largest bid price decreases between 3/21/25-3/28/25
| RANK | NAME | CHANGE | PRC | PRC-1W | DEALERS |
|---|---|---|---|---|---|
| 1 | ACPRODUCTS TL B | -5.49% | 66.67 | 70.54 | 12 |
| 2 | CERBA HEALTHCARE EUR TL D | -5.28% | 85.26 | 90.02 | 12 |
| 3 | LESLIE’S POOLMART TL B | -4.99% | 75.23 | 79.18 | 18 |
| 4 | PRINCE MINERALS TL | -4.50% | 88.52 | 92.70 | 15 |
| 5 | RACKSPACE HOSTING TL B | -3.56% | 47.21 | 48.96 | 13 |
| 6 | MULTI-COLOR TL B | -3.50% | 83.96 | 87.01 | 15 |
| 7 | TEKNI-PLEX TL B6 | -2.48% | 96.71 | 99.18 | 13 |
| 8 | OLDCASTLE TL B | -2.41% | 93.43 | 95.74 | 14 |
| 9 | CORNERSTONE BUILDING BRANDS TL | -1.85% | 85.16 | 86.77 | 14 |
| 10 | LEAF HOME SOLUTIONS TL | -1.77% | 84.32 | 85.84 | 9 |
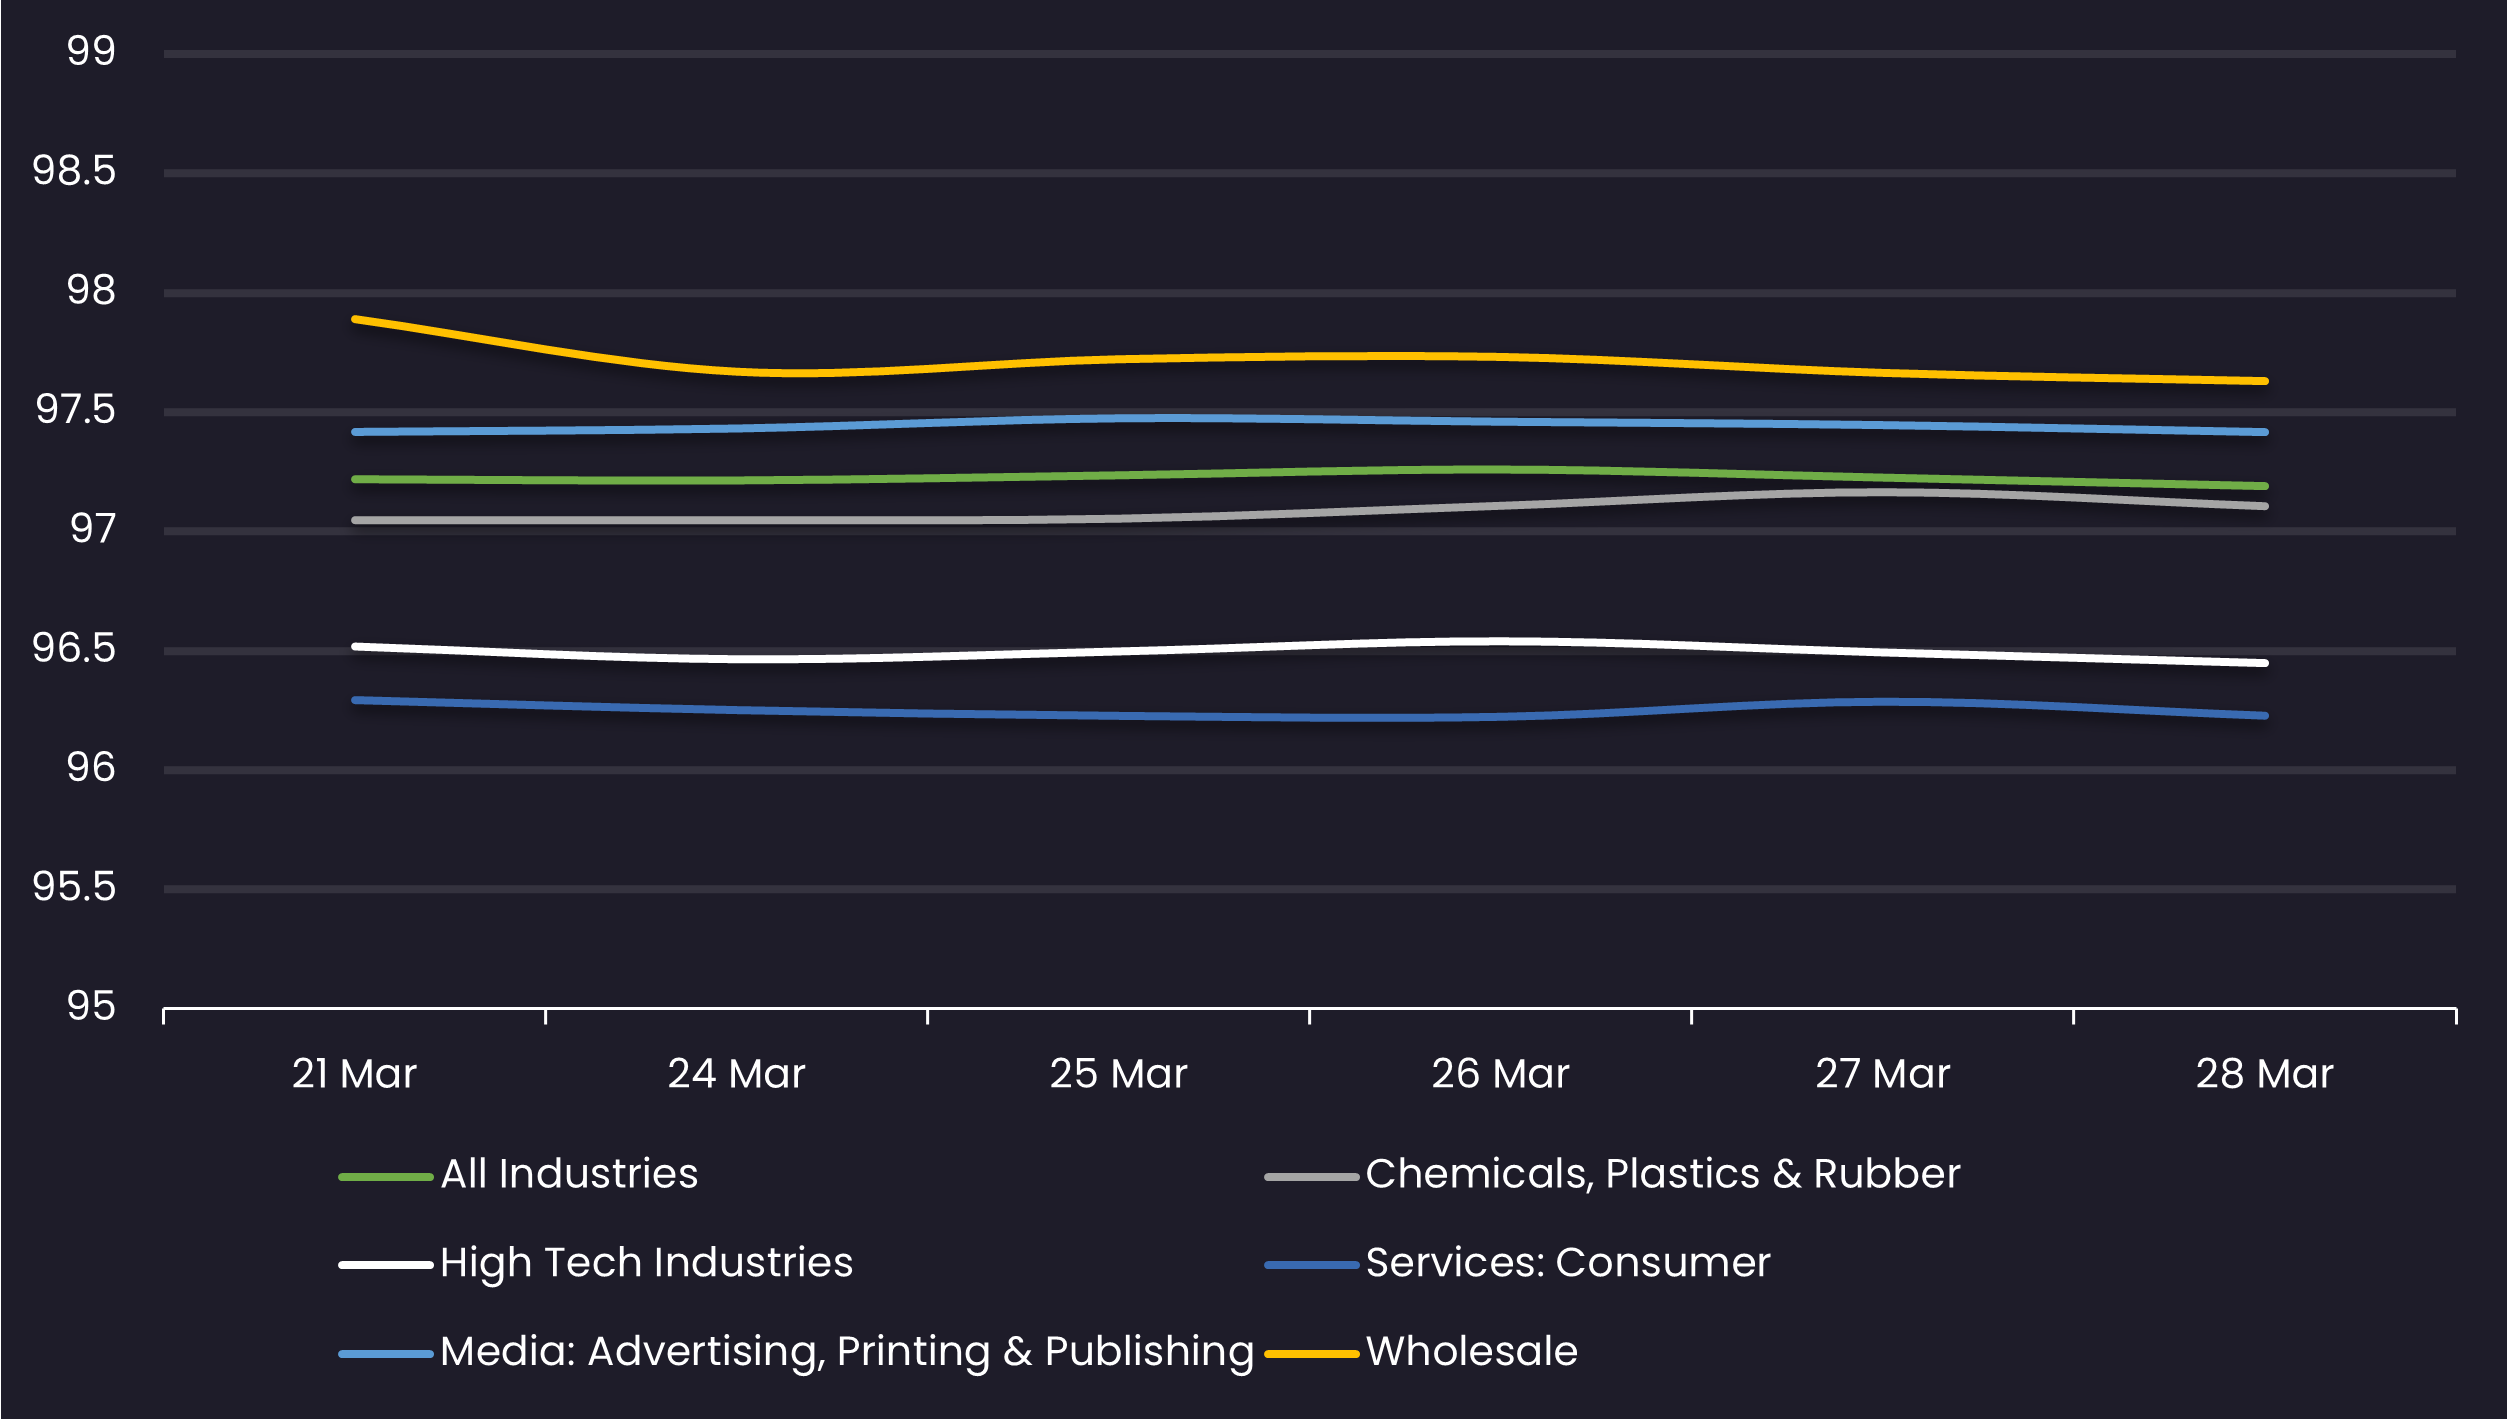
Avg Bid PX by Sector
Displays the average loan bid price by sector between 3/21/25-3/28/25 Results are based on 5 select industry sectors, however, we offer data across 36 sectors
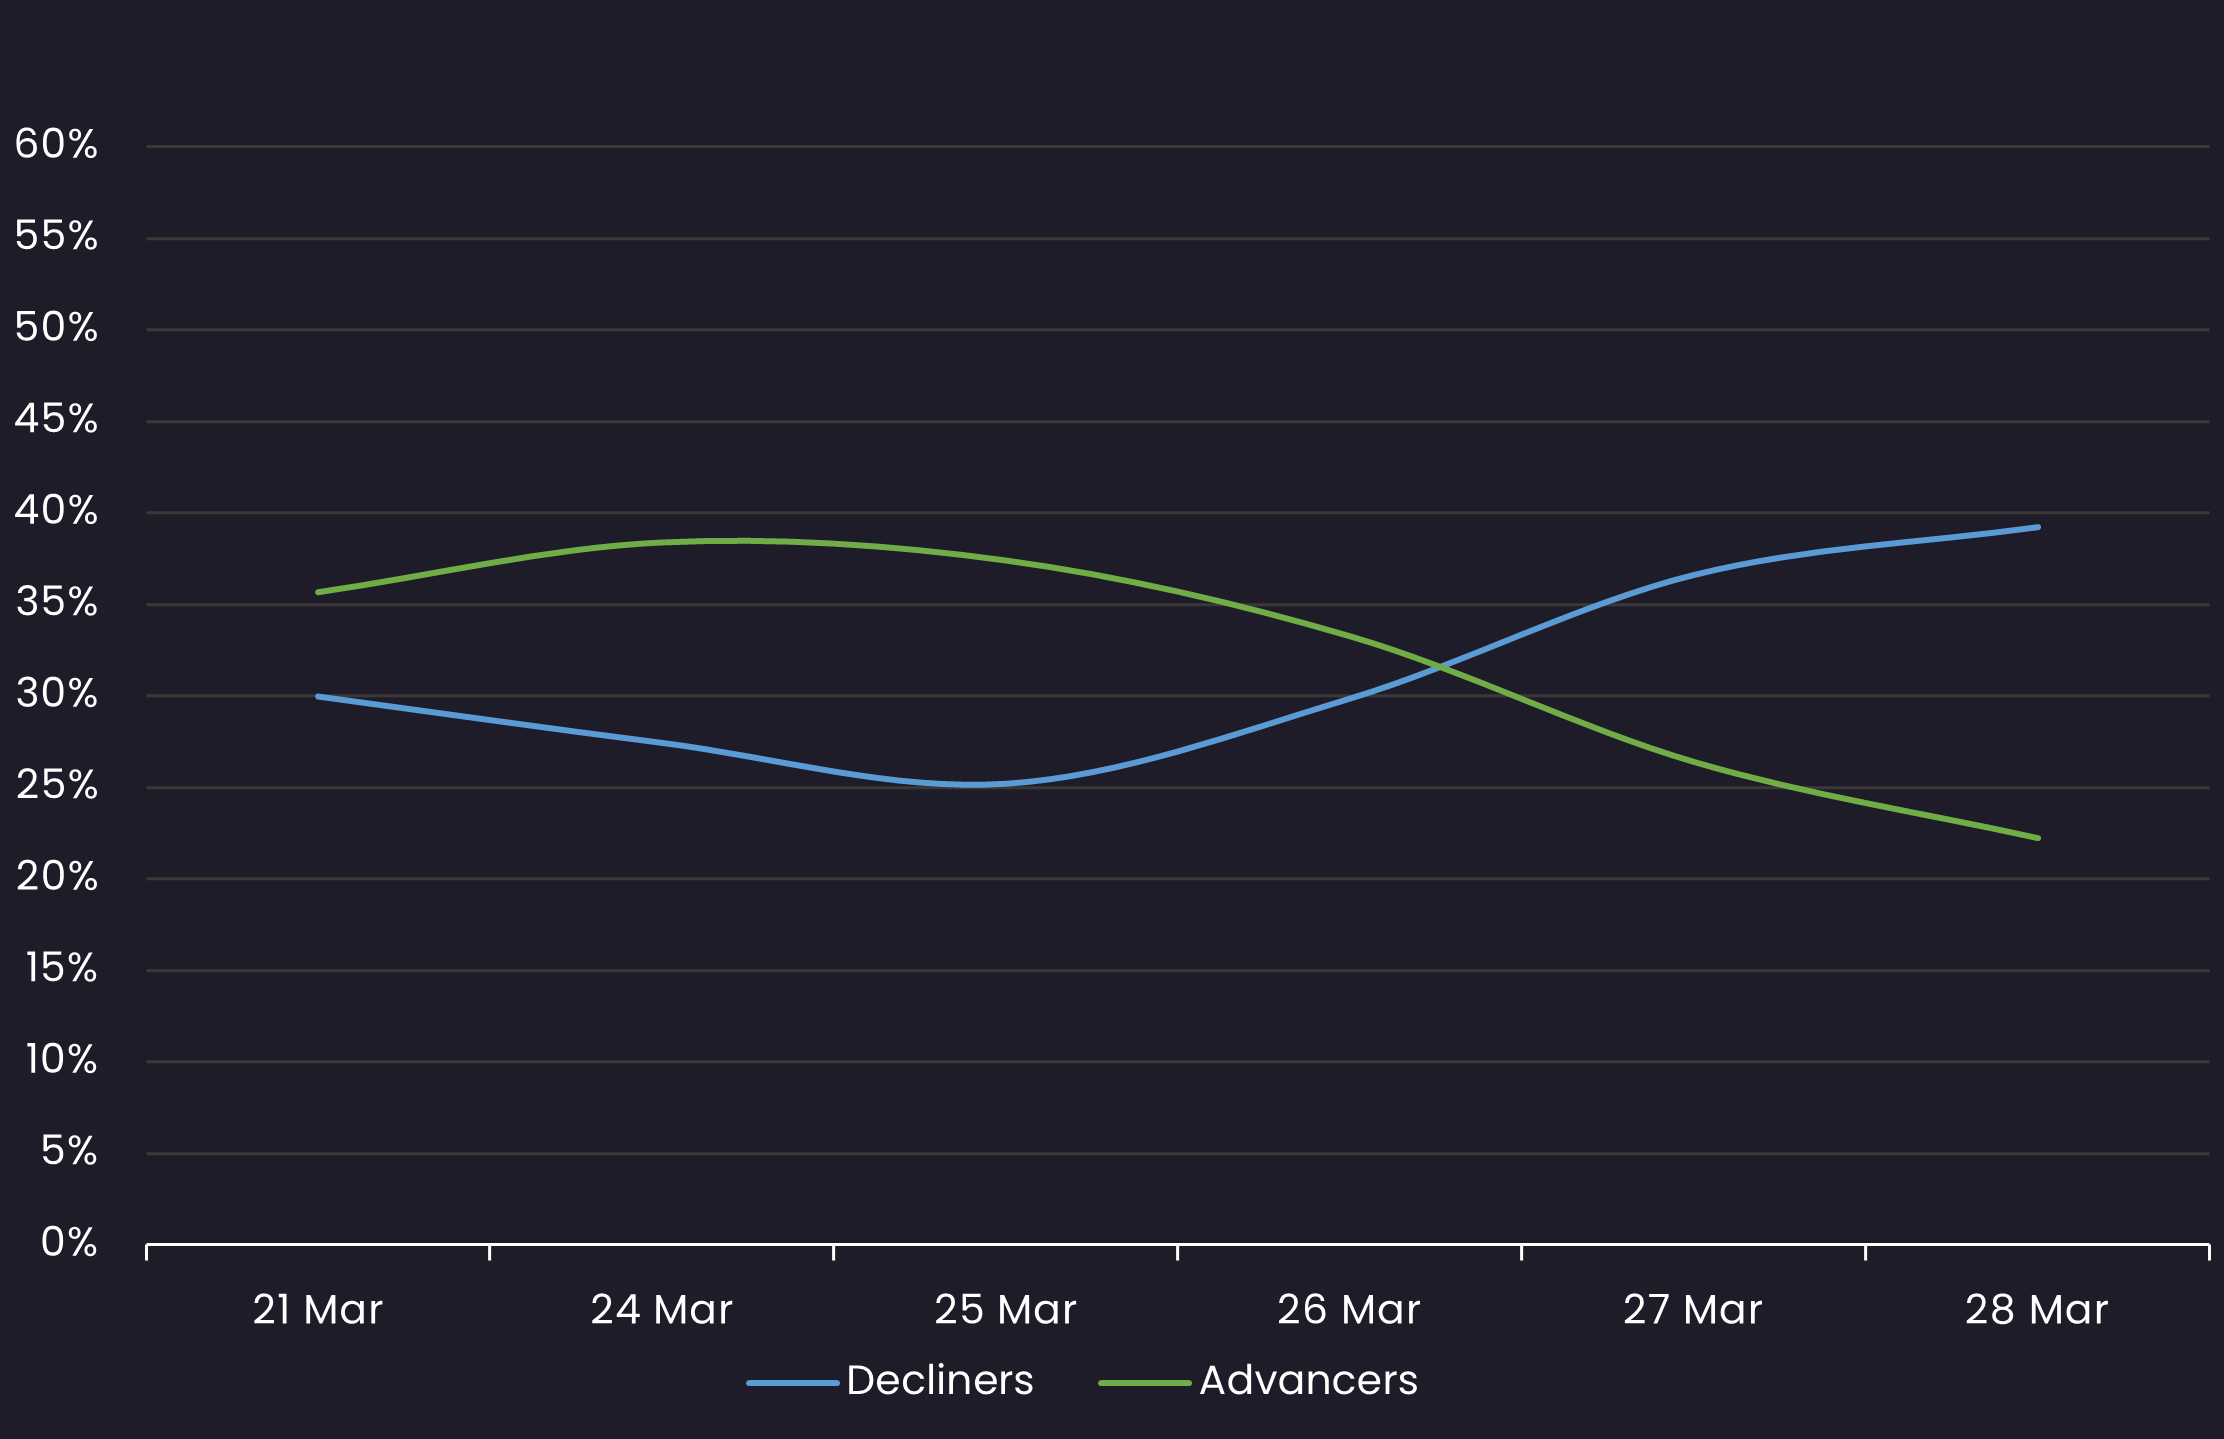
Sentiment
Reveals the percent of loans increasing in price (advancers) vs. loans decreasing in price (decliners) between 3/21/25-3/28/25
Top Quote Volume Movers: This Week vs Last Week
Exhibits the loans with the largest increase in quote volume for the week ending 3/21/25 vs. the week ending 3/28/25
| RANK | TRANCHE | PRIOR WEEK | THIS WEEK | INCREASE | % INCREASE |
|---|---|---|---|---|---|
| 1 | CERBA HEALTHCARE EUR TL D | 14 | 56 | 42 | 300% |
| 2 | ROCKET SOFTWARE EUR TL B | 20 | 48 | 28 | 140% |
| 3 | COLISEE PATRIMOINE EUR TL B | 14 | 42 | 28 | 200% |
| 4 | SITEL LLC / SITEL FIN CORP TL B | 50 | 78 | 28 | 56% |
| 5 | BOELS HOLDING EUR TL B3 | 30 | 58 | 28 | 93% |
| 6 | ZIGGO EUR TL H | 57 | 84 | 27 | 47% |
| 7 | P&I PERSONAL & INFORMATIK EUR TL B | 6 | 32 | 26 | 433% |
| 8 | POTTERS BORROWER LP TL B | 22 | 48 | 26 | 118% |
| 9 | COGNITA FINANCING PLC EUR TL B2 | 24 | 48 | 24 | 100% |
| 10 | SIGNATURE AVIATION TL B | 61 | 84 | 23 | 38% |
Most Quoted Loans
Ranks the loans that were quoted by the highest number of dealers between 3/21/25-3/28/25
| RANK | TRANCHE | DEALERS |
|---|---|---|
| 1 | WHITE CAP BUYER LLC TL B | 21 |
| 2 | ALLIANT HLDGS I INC TL B | 20 |
| 3 | GOLDEN NUGGET INC TL B | 20 |
| 4 | HUB INTL LTD TL B | 20 |
| 5 | AMWINS TL B | 20 |
| 6 | ROCKET SOFTWARE TL B | 19 |
| 7 | GO DADDY TL B | 19 |
| 8 | LESLIE’S POOLMART TL B | 18 |
| 9 | TRANSDIGM INC. TL K | 18 |
| 10 | SS&C TECH TL B8 | 18 |
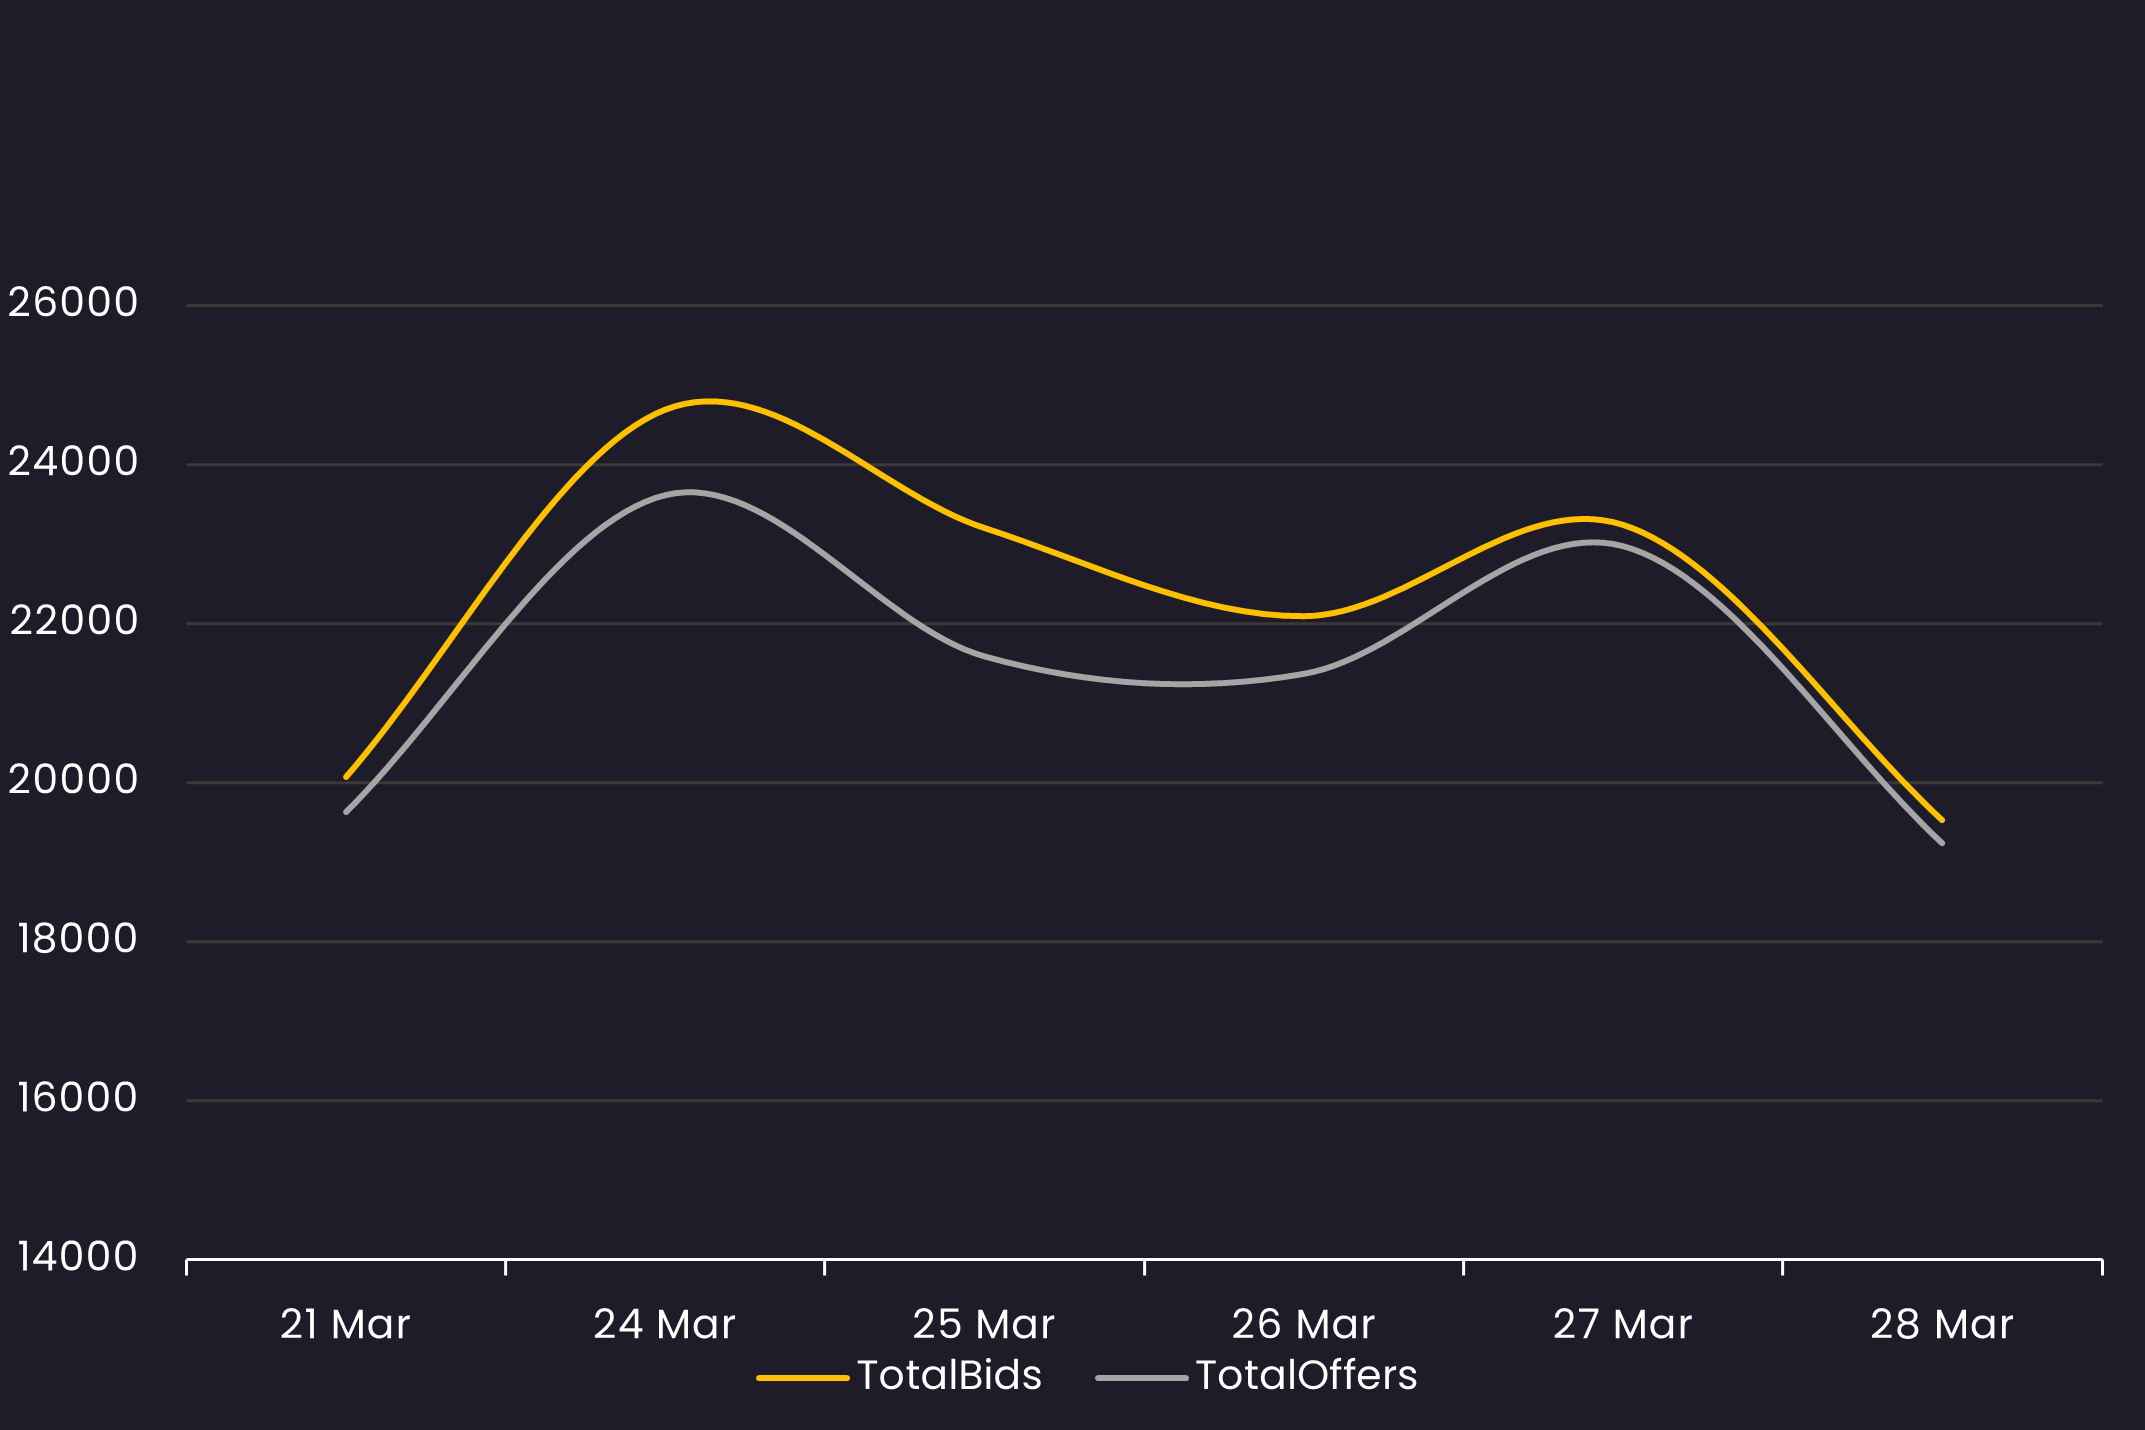
Bid and Offer Volume
Reveals the total number of quotes by bid and offer between 3/21/25-3/28/25
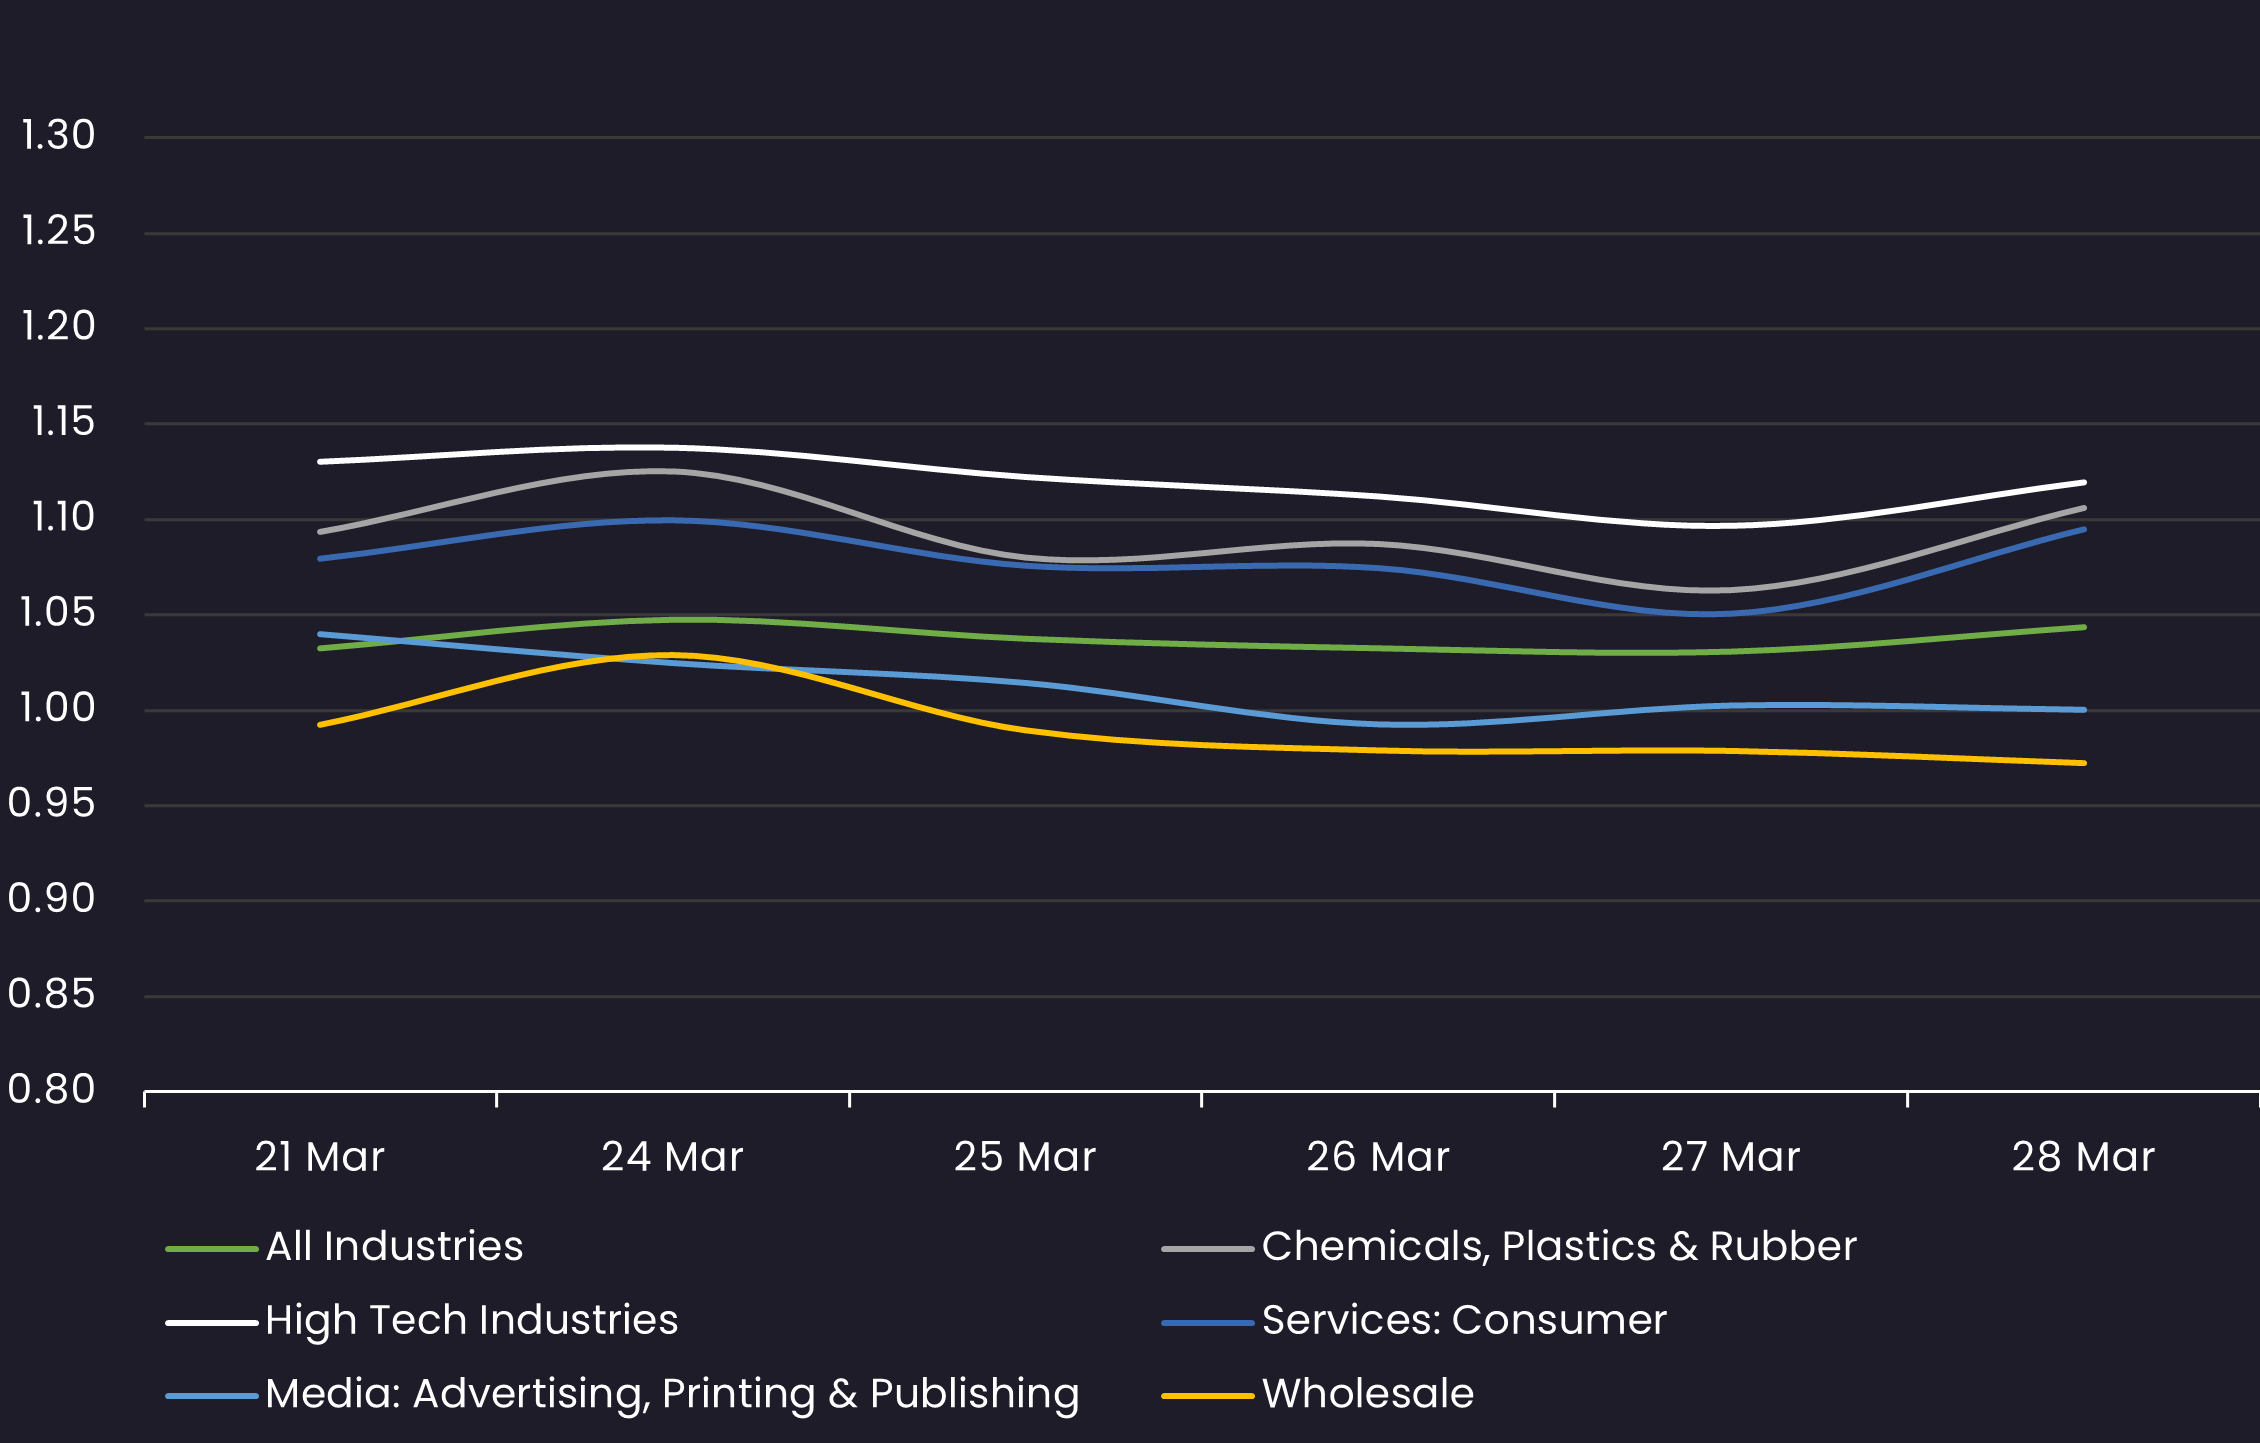
Sector Bid-Offer Spread
Results are based on 5 select industry sectors, however, we offer data across 36 sectors
Stay up-to-date with weekly summaries.
Related Resources
About SOLVE
SOLVE is the leading market data platform provider for fixed-income securities, trusted by sophisticated buy-side and sell-side firms worldwide. Founded in 2011, SOLVE leverages its AI-driven technology and deep industry expertise to offer unparalleled transparency into markets, reduce risk, and save hundreds of hours across front-office workflows. With the largest real-time datasets for Securitized Products, Municipal Bonds, Corporate Bonds, Syndicated Bank Loans, Convertible Bonds, CDS, and Private Credit, SOLVE empowers clients to transform the way they bring new securities to market, trade on secondary markets, and value highly illiquid securities. Headquartered in Connecticut, with offices across the globe, SOLVE is the definitive source for market pricing in fixed-income markets.
