Investment Grade Corporate Bond Market Summary – Week Ending 12/13/24
GET OUR CORPORATE MARKET SUMMARIES STRAIGHT TO YOUR INBOX. LEARN MORE
Investment Grade Corporate Bond Market Summary: Week Ending 12/13/24
Our newsletter presents key trends derived from observable Corporate Bond pricing data over a weekly period.
New Issues
IG Corp bond new issues for the week ending 12/13/24, issue size of $50 million and larger
| ISSUE | COLLATERAL TYPE | AMT ISSUED (MM) | PRC AT ISSUANCE | YIELD AT ISSUANCE (%) | SPREAD AT ISSUE |
|---|---|---|---|---|---|
| Arthur J Gallagher & Co. (USD) 5.55% 2/15/2055 | Senior Note | 1500 | 99.376 | 5.59 | 117 |
| Toronto-Dominion Bank (USD) 4.568% 12/17/2026 | Senior Note | 1100 | 100 | 4.57 | 45 |
| ANZ Banking Group LTD (USD) 5.47% 12/16/2029 | Senior Note | 900 | 100 | ||
| Arthur J Gallagher & Co. (USD) 4.85% 12/15/2029 | Senior Note | 750 | 99.922 | 4.87 | 77 |
Top 10 Performers
Showcases the top 10 IG Corp performers based on the largest bid price increases between 12/6/24 – 12/13/24
| RANK | BOND NAME | COUPON | MATURITY | CHANGE | PRC | PRC-1W | DEALERS |
|---|---|---|---|---|---|---|---|
| 1 | WBA 4.4 9/15/2042 | 4.40% | 09/15/42 | 5.74% | 67.25 | 63.60 | 18 |
| 2 | SBBBSS 2.375 9/4/2026 | 2.38% | 09/04/26 | 4.59% | 86.68 | 82.87 | 20 |
| 3 | LNGFOR 3.95 9/16/2029 | 3.95% | 09/16/29 | 3.62% | 76.99 | 74.30 | 17 |
| 4 | HEIMST 6.75 PERP | 6.75% | NULL | 3.03% | 75.99 | 73.76 | 16 |
| 5 | SWSFIN 7.75 10/31/2031 | 7.75% | 10/31/31 | 2.47% | 89.78 | 87.62 | 14 |
| 6 | ARES 6.75 10/1/2027 | 6.75% | 10/01/27 | 2.46% | 57.33 | 55.95 | 4 |
| 7 | KSS 5.55 7/17/2045 | 5.55% | 07/17/45 | 1.89% | 66.14 | 64.91 | 23 |
| 8 | ALVGR 2.6 PERP | 2.60% | NULL | 1.64% | 84.79 | 83.42 | 22 |
| 9 | HGB 2.25 6/22/2034 | 2.25% | 06/22/34 | 1.55% | 72.03 | 70.93 | 3 |
| 10 | OPMFP 4.875 3/13/2029 | 4.88% | 03/13/29 | 1.49% | 103.08 | 101.57 | 13 |
Bottom 10 Performers
Showcases the bottom 10 IG Corp performers based on the largest bid price decreases between 12/6/24 – 12/13/24
| RANK | BOND NAME | COUPON | MATURITY | CHANGE | PRC | PRC-1W | DEALERS |
|---|---|---|---|---|---|---|---|
| 1 | PERU 2.78 12/1/2060 | 2.78% | 12/01/60 | -5.14% | 55.48 | 58.49 | 20 |
| 2 | MEX 3.75 4/19/2071 | 3.75% | 04/19/71 | -4.88% | 57.65 | 60.60 | 22 |
| 3 | TEMASE 2.5 10/6/2070 144A | 2.50% | 10/06/70 | -4.86% | 60.48 | 63.57 | 6 |
| 4 | MASSMU 4.5 4/15/2065 144A | 4.50% | 04/15/65 | -4.63% | 76.58 | 80.30 | 10 |
| 5 | SLOVGB 2.25 6/12/2068 | 2.25% | 06/12/68 | -4.48% | 69.04 | 72.28 | 4 |
| 6 | CHILE 3.25 9/21/2071 | 3.25% | 09/21/71 | -4.39% | 61.60 | 64.43 | 21 |
| 7 | WBD 5.391 3/15/2062 | 5.39% | 03/15/62 | -4.36% | 77.70 | 81.24 | 29 |
| 8 | UNH 5.75 7/15/2064 | 5.75% | 07/15/64 | -4.35% | 100.11 | 104.66 | 22 |
| 9 | LLY 1.375 9/14/2061 | 1.38% | 09/14/61 | -4.27% | 59.04 | 61.67 | 14 |
| 10 | CHINA 2.25 10/21/2050 REGS | 2.25% | 10/21/50 | -4.15% | 65.33 | 68.16 | 14 |
Top 10 Industry Performers
Showcases the top 10 IG industry performers based on the largest yield increases between 12/6/24 – 12/13/24
| RANK | INDUSTRY | CHANGE | YLD | YLD-1W |
|---|---|---|---|---|
| 1 | Finance | -30 bps | 5.27% | 5.58% |
| 2 | Media: Advertising, Printing & Publishing | -7 bps | 6.24% | 6.31% |
| 3 | Real Estate | -6 bps | 5.99% | 6.05% |
| 4 | Utilities: Oil & Gas | -4 bps | 4.56% | 4.60% |
| 5 | Services: Consumer | -2 bps | 4.76% | 4.78% |
| 6 | Hotel, Gaming & Leisure | -1 bps | 4.80% | 4.81% |
| 7 | Energy: Electricity | 0 bps | 11.02% | 11.02% |
| 8 | Containers, Packaging, & Glass | 0 bps | 4.77% | 4.77% |
| 9 | Chemicals, Plastics & Rubber | 2 bps | 4.75% | 4.73% |
| 10 | Retail | 2 bps | 4.82% | 4.79% |
Bottom 10 Industry Performers
Showcases the bottom 10 IG industry performers based on the largest yield decreases between 12/6/24 – 12/13/24
| RANK | INDUSTRY | CHANGE | YLD | YLD-1W |
|---|---|---|---|---|
| 1 | Media: Diversified & Production | 50 bps | 4.65% | 4.15% |
| 2 | Metals & Mining | 14 bps | 4.74% | 4.60% |
| 3 | Transportation: Cargo | 13 bps | 4.64% | 4.51% |
| 4 | Environmental Industries | 12 bps | 4.68% | 4.56% |
| 5 | Telecommunications | 12 bps | 4.49% | 4.37% |
| 6 | Capital Equipment | 11 bps | 4.24% | 4.13% |
| 7 | Transportation: Consumer | 11 bps | 4.50% | 4.39% |
| 8 | Consumer Goods: Non-Durable | 10 bps | 4.46% | 4.36% |
| 9 | High Tech Industries | 10 bps | 4.63% | 4.53% |
| 10 | Consumer Goods: Durable | 9 bps | 3.95% | 3.85% |
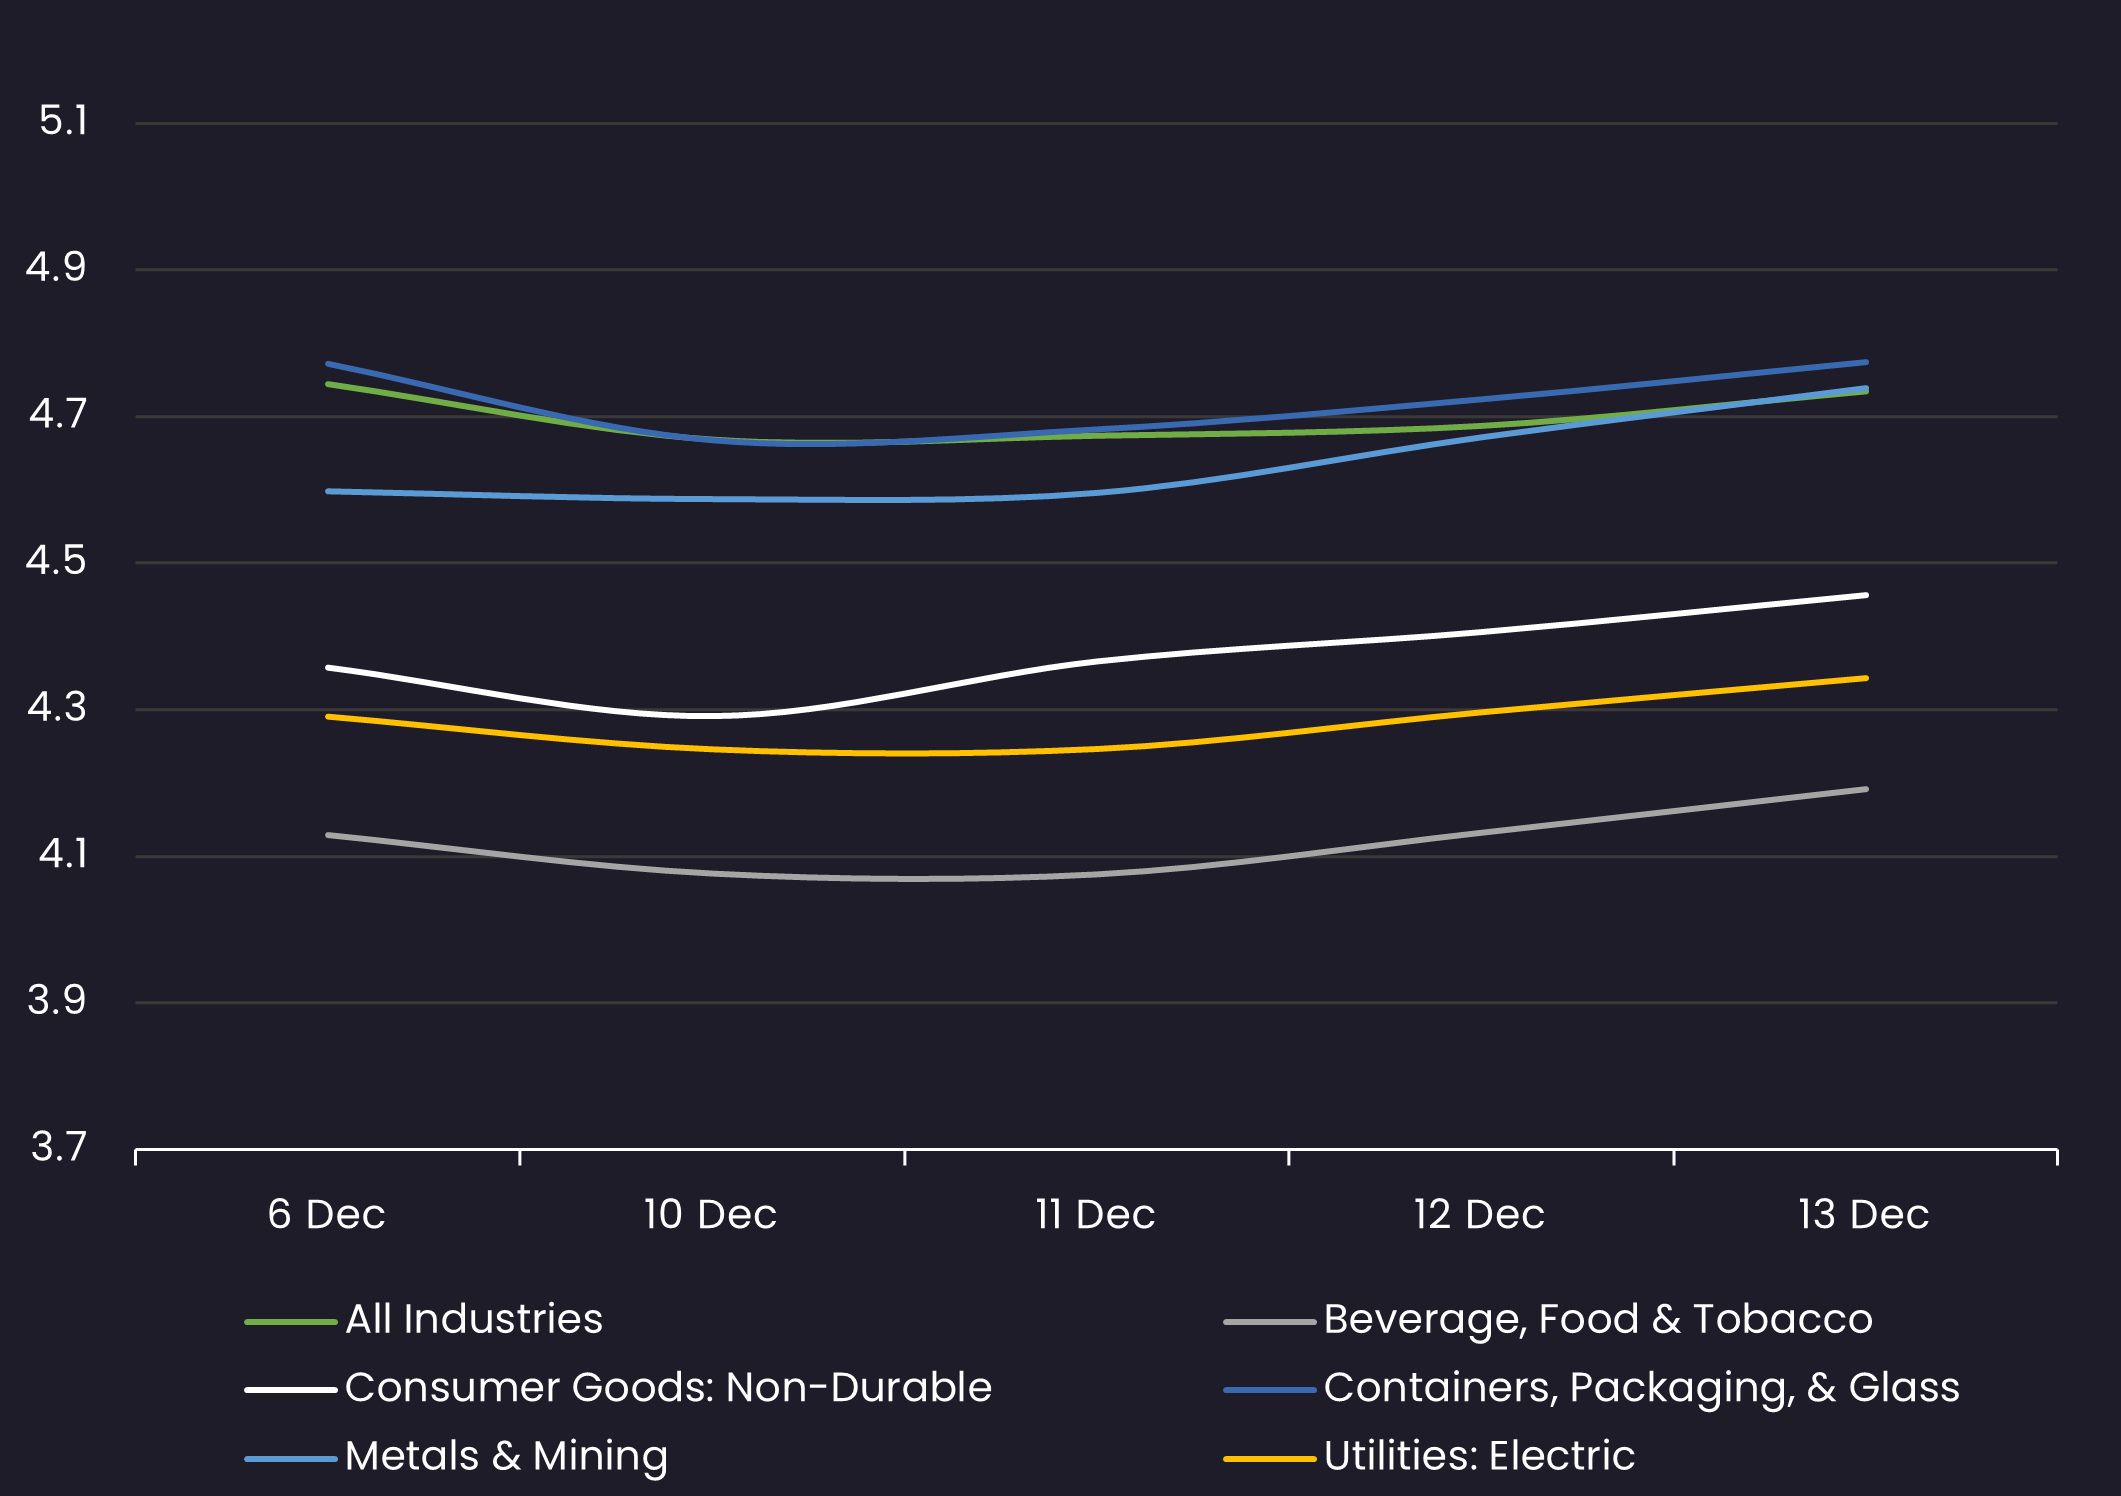
5 Year Yield By Industry
Displays the average IG Corp 5 year yield by industry between 12/6/24 – 12/13/24 Results are based on 5 select industry sectors, however, we offer data across 36 sectors
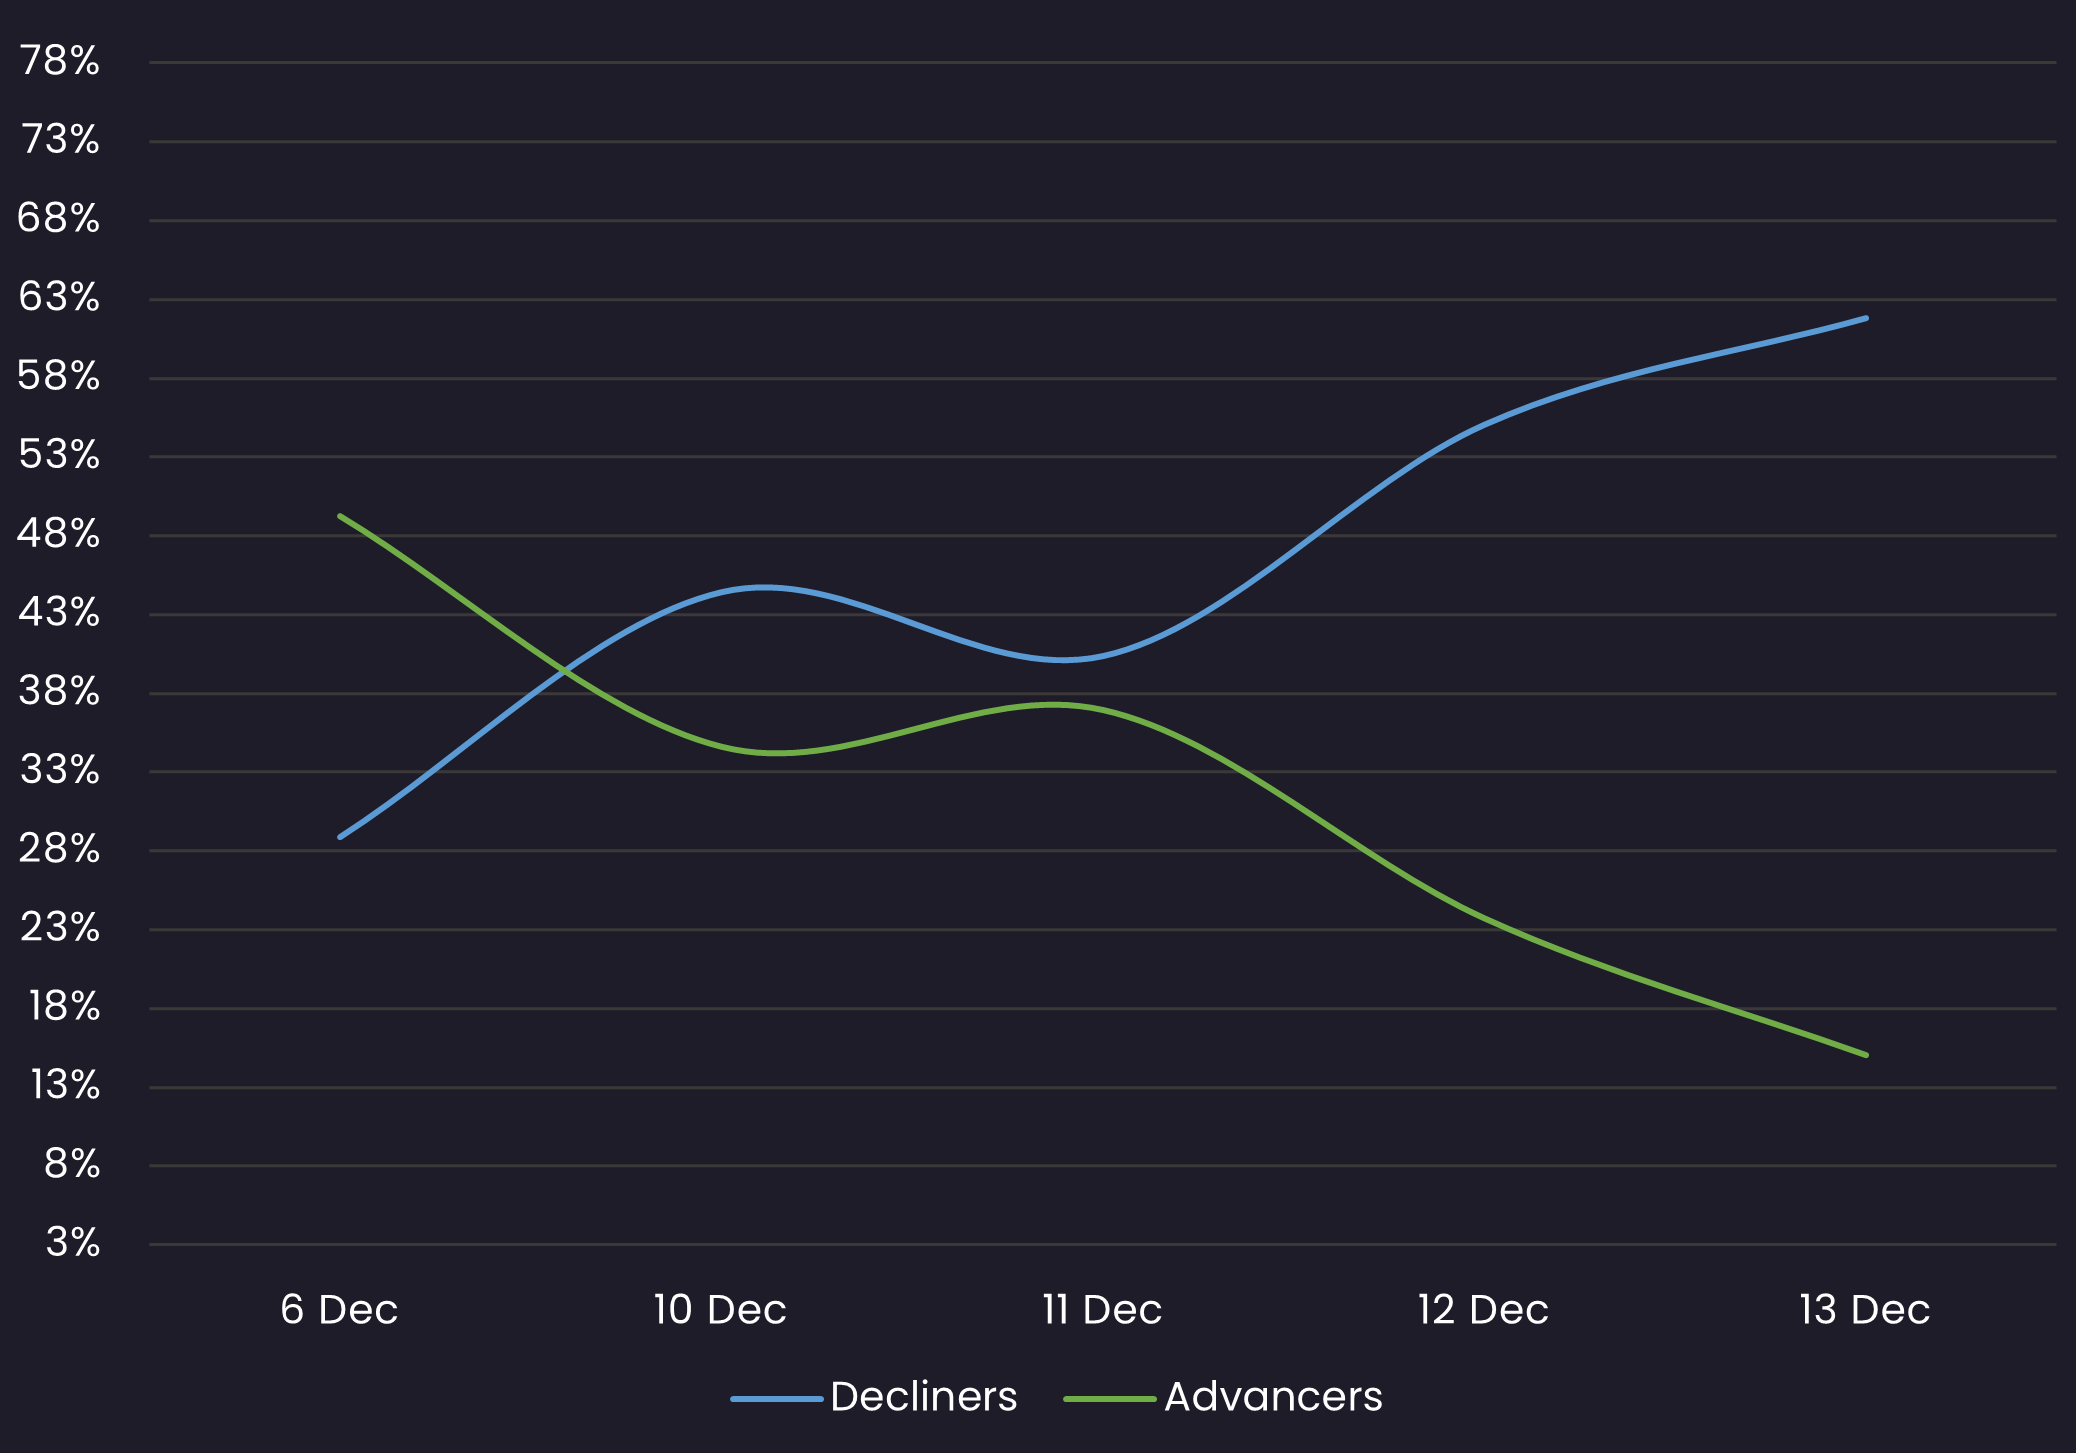
Sentiment
Reveals the percent of IG Corps increasing in price (advancers) vs. IG Corps decreasing in price (decliners) between 12/6/24 – 12/13/24
Top Quote Volume Movers: This Week vs Last Week
Exhibits the IG Corps with the largest increase in quote volume for the week ending 12/6/24 vs. the week ending 12/13/24
| RANK | TRANCHE | COUPON | MATURITY | PRIOR WEEK | THIS WEEK | INCREASE | % INCREASE |
|---|---|---|---|---|---|---|---|
| 1 | WRK 7.95 2/15/2031 | 7.95% | 02/15/31 | 50 | 116 | 66 | 132% |
| 2 | ENELIM 0.625 5/28/2029 | 0.63% | 05/28/29 | 135 | 200 | 65 | 48% |
| 3 | TFC 4.632 9/17/2029 | 4.65% | 09/17/29 | 65 | 125 | 60 | 92% |
| 4 | BACR 4.375 1/12/2026 | 4.38% | 01/12/26 | 132 | 192 | 60 | 45% |
| 5 | ENELIM 0.25 5/28/2026 | 0.25% | 05/28/26 | 170 | 225 | 55 | 32% |
| 6 | SW 4.9 3/15/2029 | 4.90% | 03/15/29 | 58 | 113 | 55 | 95% |
| 7 | EDF 6 1/22/2014 REGS | 6.00% | 01/22/14 | 60 | 113 | 53 | 88% |
| 8 | CSCO 5.5 1/15/2040 | 5.50% | 01/15/40 | 208 | 260 | 52 | 25% |
| 9 | SW 3 6/15/2033 | 3.00% | 06/15/33 | 95 | 145 | 50 | 53% |
| 10 | SW 3.9 6/1/2028 | 3.90% | 06/01/28 | 80 | 129 | 49 | 61% |
Most Quoted IG Corps
Ranks the IG Corps that were quoted by the highest number of dealers between 12/6/24 – 12/13/24
| RANK | TRANCHE | COUPON | MATURITY | DEALERS |
|---|---|---|---|---|
| 1 | HSBC 8 PERP | 8.00% | 09/07/99 | 38 |
| 2 | T 2.55 12/1/2033 | 2.55% | 12/01/33 | 36 |
| 3 | T 5.4 2/15/2034 | 5.40% | 02/15/34 | 36 |
| 4 | BPLN 5.227 11/17/2034 | 5.23% | 11/17/34 | 36 |
| 5 | HSBC 5.874 11/18/2035 | 5.87% | 11/18/35 | 36 |
| 6 | T 4.35 3/1/2029 | 4.35% | 03/01/29 | 35 |
| 7 | HSBC 6.375 PERP | 6.38% | NULL | 35 |
| 8 | HSBC 6.5 PERP | 6.50% | NULL | 35 |
| 9 | HPE 5 10/15/2034 | 5.00% | 10/15/34 | 35 |
| 10 | WBD 5.05 3/15/2042 | 5.05% | 03/15/42 | 35 |
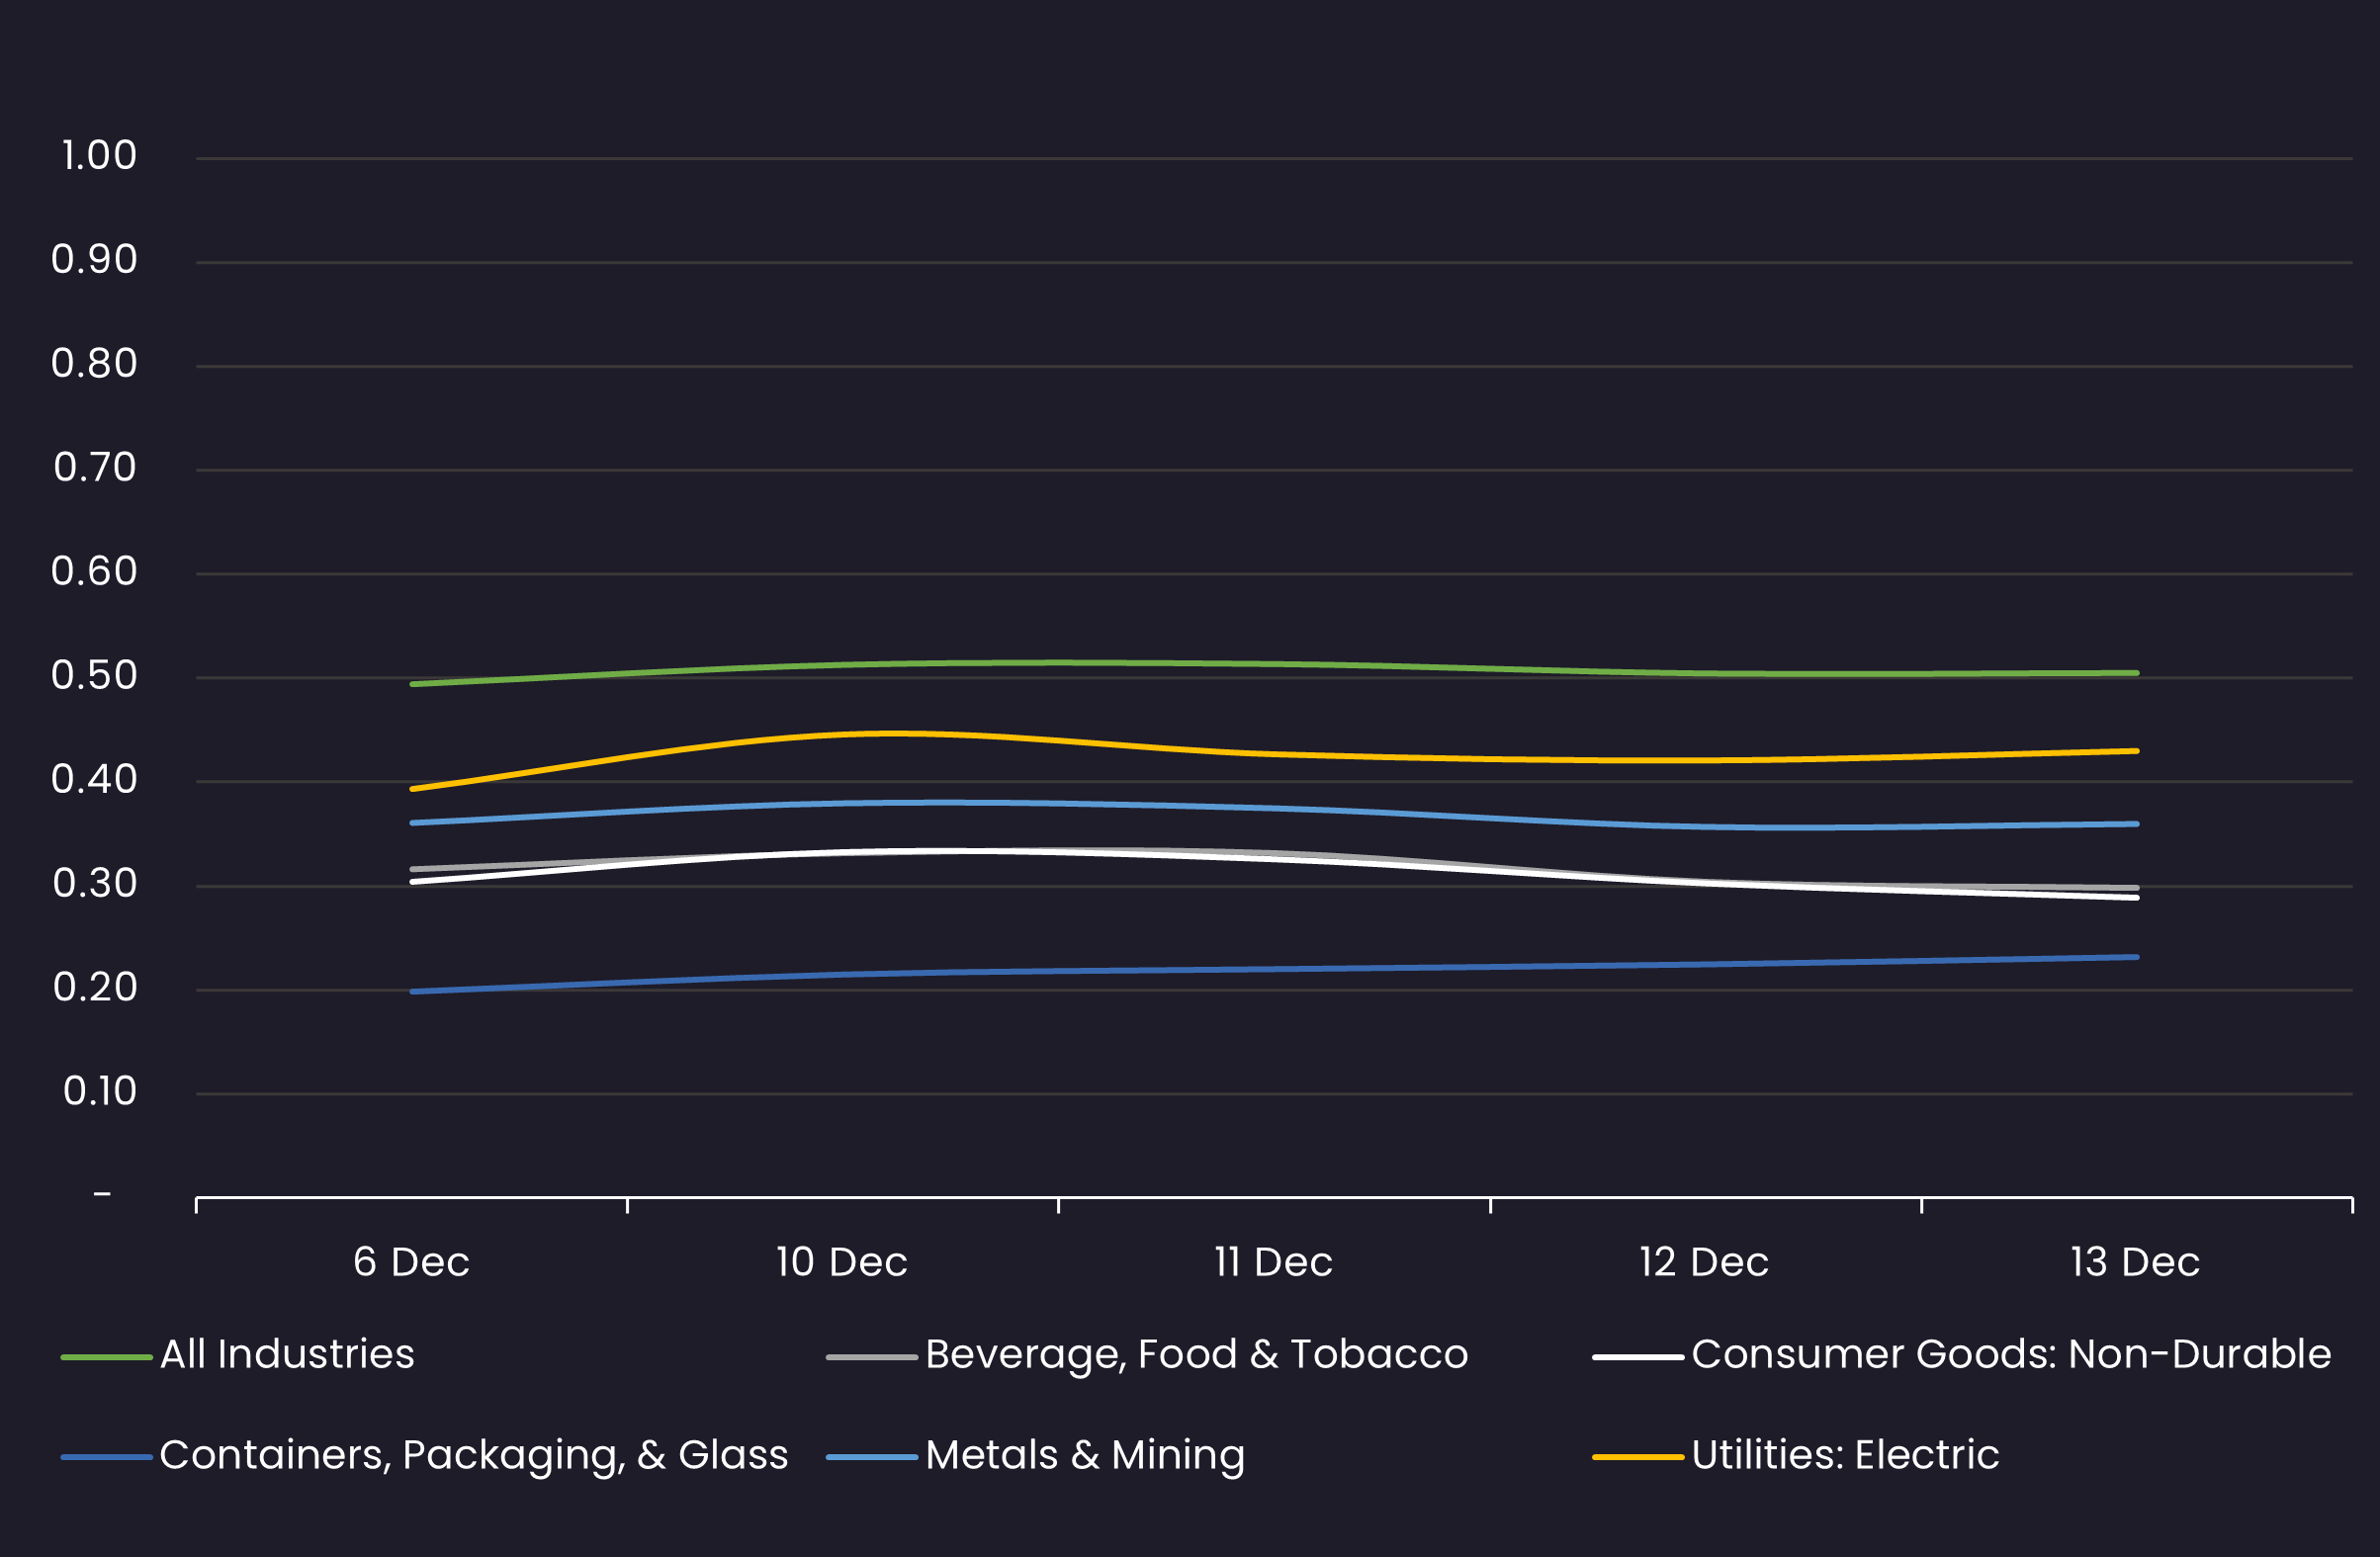
Bid-Offer Spread by Industry
Displays the IG Corp average bid-offer spread by industry between 12/6/24 – 12/13/24 Results are based on 5 select industry sectors, however, we offer data across 36 sectors
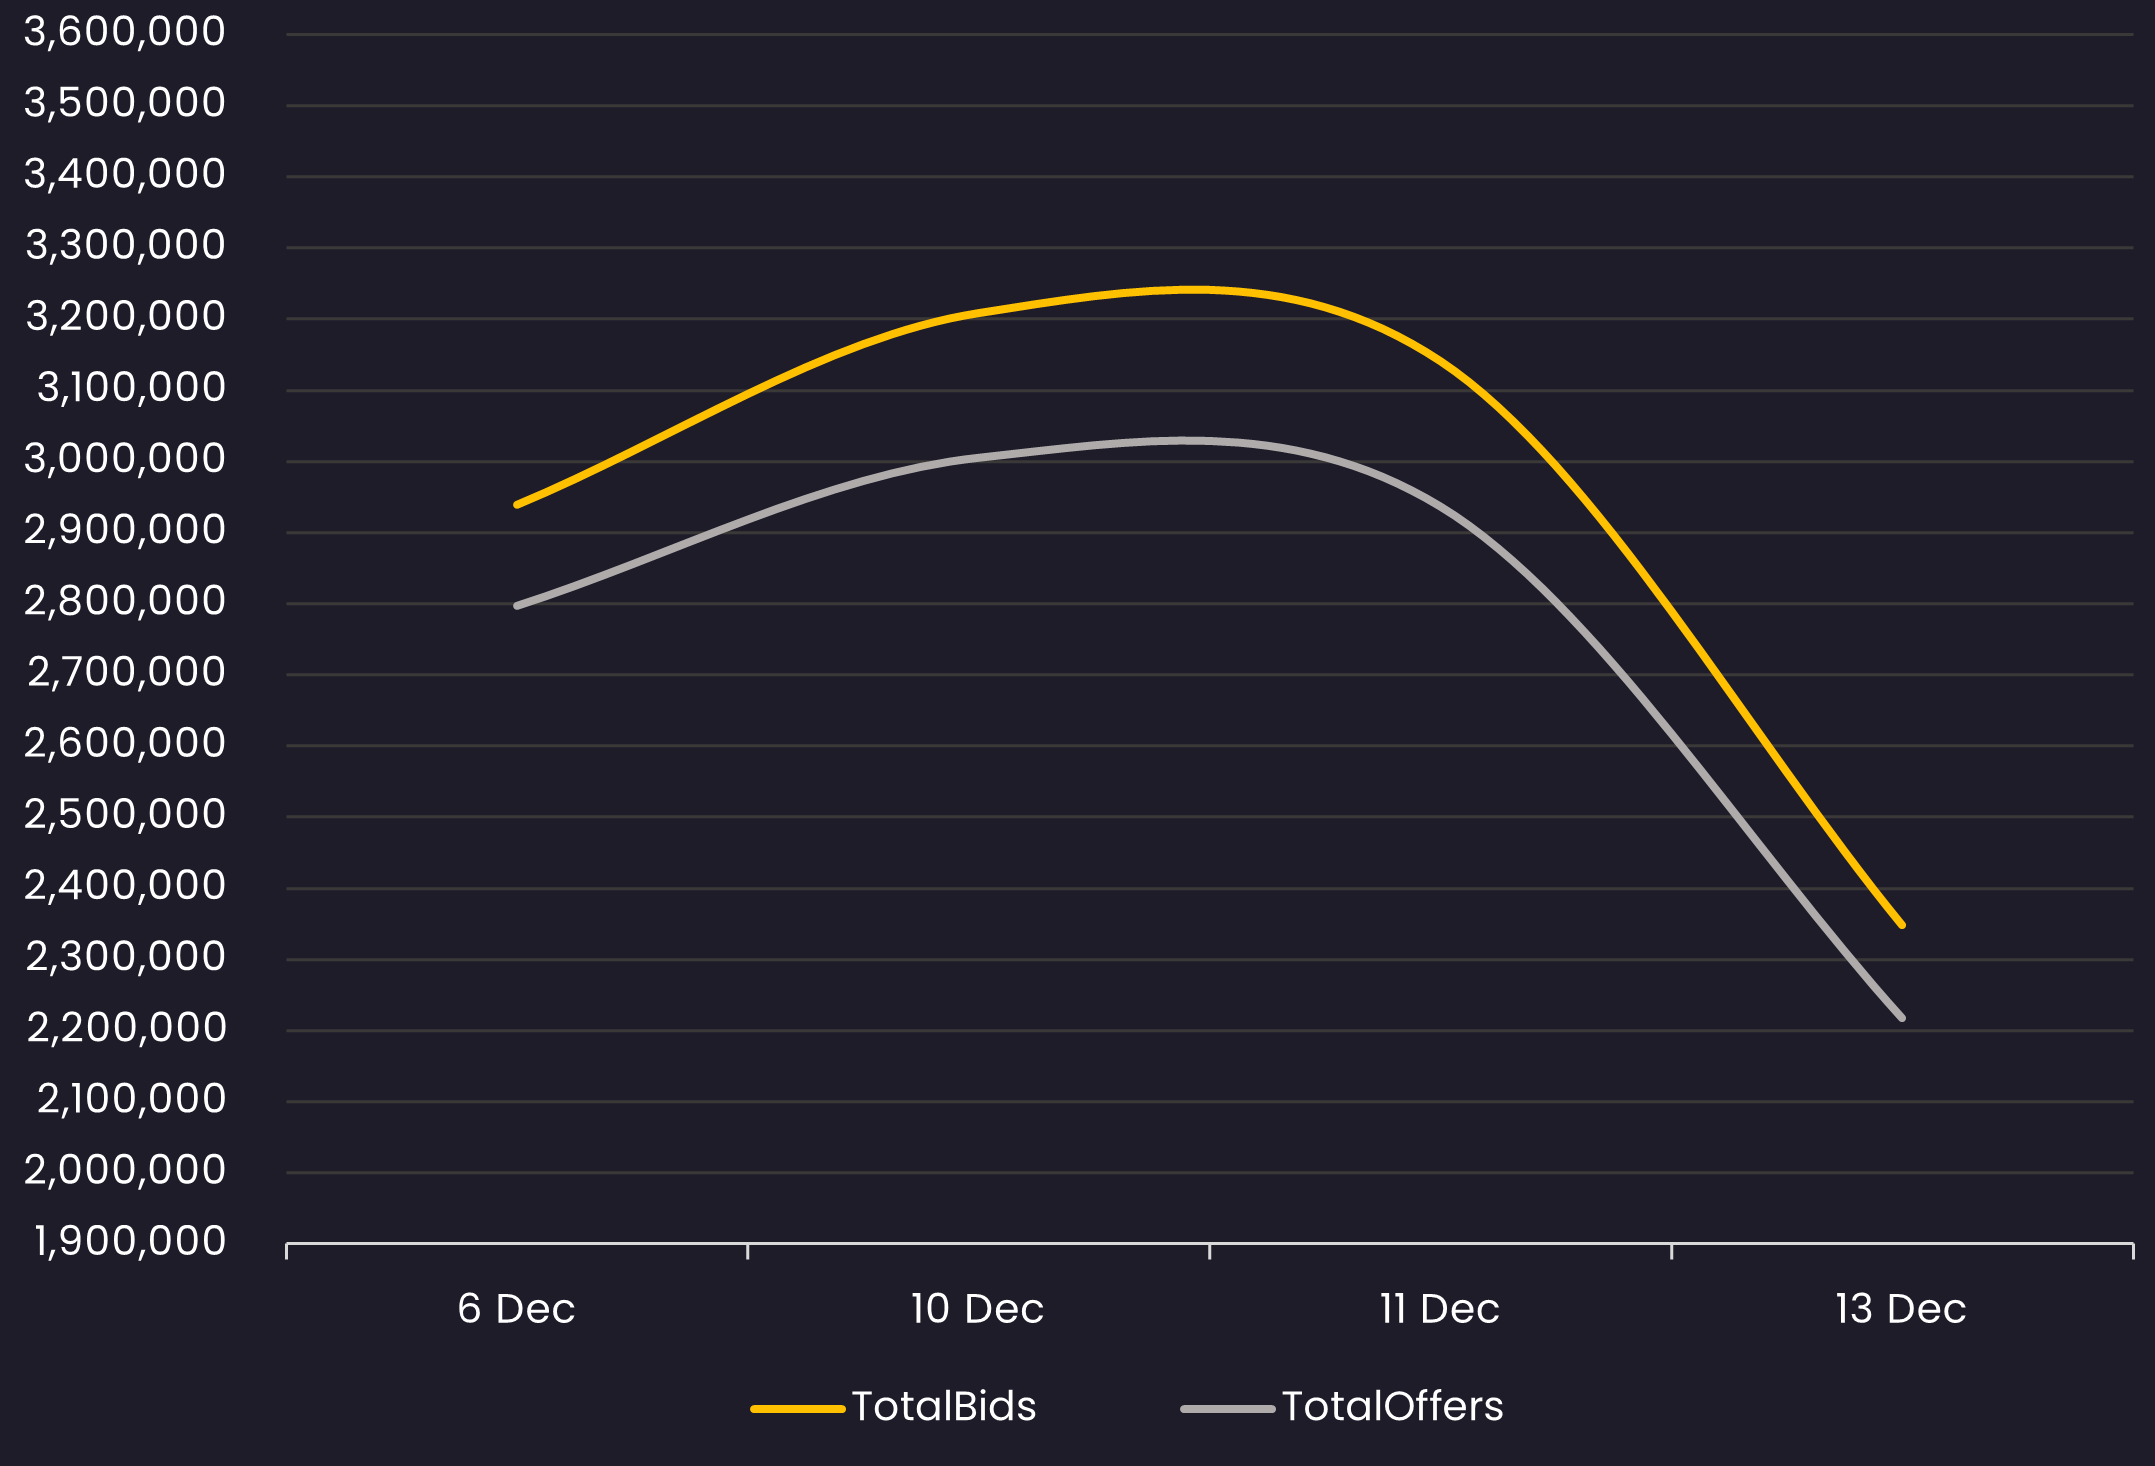
Bid and Offer Volume
Reveals the total number of quotes by bid and offer between 12/6/24 – 12/13/24
Stay up-to-date with weekly summaries.
Related Resources
About SOLVE
SOLVE is the leading market data platform provider for fixed-income securities, trusted by sophisticated buy-side and sell-side firms worldwide. Founded in 2011, SOLVE leverages its AI-driven technology and deep industry expertise to offer unparalleled transparency into markets, reduce risk, and save hundreds of hours across front-office workflows. With the largest real-time datasets for Securitized Products, Municipal Bonds, Corporate Bonds, Syndicated Bank Loans, Convertible Bonds, CDS, and Private Credit, SOLVE empowers clients to transform the way they bring new securities to market, trade on secondary markets, and value highly illiquid securities. Headquartered in Connecticut, with offices across the globe, SOLVE is the definitive source for market pricing in fixed-income markets.
