Municipal Bond Market Summary – Week Ending 5/24/24
GET OUR MUNICIPAL BOND MARKET SUMMARIES STRAIGHT TO YOUR INBOX. LEARN MORE
Municipal Bond Market Summary: Week Ending 5/24/24
Our newsletter presents key trends derived from observable Municipal Bond pricing data over a weekly period.
Top 10 Performers
Showcases the top 10 Muni Bond performers based on price movements between 5/17/24-5/24/24
| RANK | BOND NAME | COUPON | MATURITY | CHANGE | PRC | PRC-1W | DEALERS |
|---|---|---|---|---|---|---|---|
| 1 | PHILADELPHIA-B-REF | 2.926% | 07/01/45 | 5.43% | 77.22 | 73.25 | 5 |
| 2 | AMERICAN MUN PWR OH | 8.084% | 02/15/50 | 4.74% | 136.58 | 130.40 | 9 |
| 3 | GREAT LAKES MI WTR AU | 3.473% | 07/01/41 | 4.02% | 85.86 | 82.54 | 3 |
| 4 | MUNICIPAL ELEC AUTH | 6.655% | 04/01/57 | 3.62% | 114.92 | 110.91 | 9 |
| 5 | CVI-HTA 98 SUB CLAIM | 0.000% | 11/01/51 | 3.44% | 30.01 | 29.01 | 5 |
| 6 | HOWARD CO HSG-GATEWAY | 4.000% | 06/01/46 | 3.40% | 95.37 | 92.24 | 3 |
| 7 | WISCONSIN ST HLTH | 4.000% | 12/15/49 | 2.75% | 94.63 | 92.10 | 4 |
| 8 | PR SALES TAX FING-A1 | 0.000% | 07/01/46 | 2.38% | 33.08 | 32.31 | 9 |
| 9 | DIST OF COLUMBIA WTR | 3.207% | 10/01/48 | 2.21% | 74.94 | 73.32 | 6 |
| 10 | OK CO FIN AUTH -REV | 6.250% | 06/15/54 | 2.21% | 100.45 | 98.28 | 2 |
Bottom 10 Performers
Showcases the bottom 10 Muni Bond performers based on price movements between 5/17/24-5/24/24
| RANK | BOND NAME | COUPON | MATURITY | CHANGE | PRC | PRC-1W | DEALERS |
|---|---|---|---|---|---|---|---|
| 1 | MO CPGMED 3.38 06/01/2035 | 3.375% | 06/01/35 | -5.21% | 91.15 | 96.16 | 2 |
| 2 | NY TARSCD 3.25 08/01/2035 | 3.250% | 08/01/35 | -5.11% | 90.58 | 95.46 | 2 |
| 3 | PA PASHGR 3.00 06/15/2036 | 3.000% | 06/15/36 | -4.80% | 88.65 | 93.12 | 2 |
| 4 | KY OHCEDU 3.55 02/01/2037 | 3.550% | 02/01/37 | -4.72% | 93.36 | 97.99 | 3 |
| 5 | CA EDRSCD 3.02 08/01/2042 | 3.016% | 08/01/42 | -4.60% | 72.52 | 76.01 | 8 |
| 6 | OR KLFMED 3.00 09/01/2035 | 3.000% | 09/01/35 | -4.58% | 89.31 | 93.59 | 2 |
| 7 | IL COU 3.00 01/01/2034 | 3.000% | 01/01/34 | -4.57% | 90.19 | 94.51 | 2 |
| 8 | SC SCSUTL 3.75 12/01/2040 | 3.750% | 12/01/40 | -4.44% | 88.97 | 93.10 | 2 |
| 9 | NC EASHGR 3.00 10/01/2034 | 3.000% | 10/01/34 | -4.39% | 89.19 | 93.28 | 2 |
| 10 | OH OHSPOL 3.00 12/01/2033 | 3.000% | 12/01/33 | -4.38% | 92.82 | 97.07 | 2 |
Top 10 State Performers
Showcases the top 10 Muni State performers based on yield movements between 5/17/24-5/24/24
| RANK | STATE | CHANGE | YLD | YLD-1W |
|---|---|---|---|---|
| 1 | AK | 12 bps | 3.66% | 3.53% |
| 2 | MD | 13 bps | 3.70% | 3.57% |
| 3 | LA | 14 bps | 3.93% | 3.79% |
| 4 | FL | 16 bps | 4.25% | 4.09% |
| 5 | MO | 16 bps | 3.97% | 3.80% |
| 6 | WI | 17 bps | 4.08% | 3.91% |
| 7 | WV | 19 bps | 3.45% | 3.26% |
| 8 | WA | 19 bps | 3.95% | 3.76% |
| 9 | SC | 19 bps | 3.66% | 3.46% |
| 10 | AL | 21 bps | 3.97% | 3.76% |
Bottom 10 State Performers
Showcases the bottom 10 Muni State performers based on yield movements between 5/17/24-5/24/24
| RANK | STATE | CHANGE | YLD | YLD-1W |
|---|---|---|---|---|
| 1 | CT | 48 bps | 4.16% | 3.68% |
| 2 | KS | 46 bps | 4.18% | 3.72% |
| 3 | NC | 43 bps | 3.80% | 3.37% |
| 4 | MS | 43 bps | 4.10% | 3.68% |
| 5 | NH | 41 bps | 4.10% | 3.69% |
| 6 | UT | 41 bps | 4.00% | 3.59% |
| 7 | RI | 40 bps | 4.04% | 3.65% |
| 8 | IA | 39 bps | 4.30% | 3.91% |
| 9 | TN | 39 bps | 3.75% | 3.36% |
| 10 | NV | 37 bps | 3.91% | 3.54% |
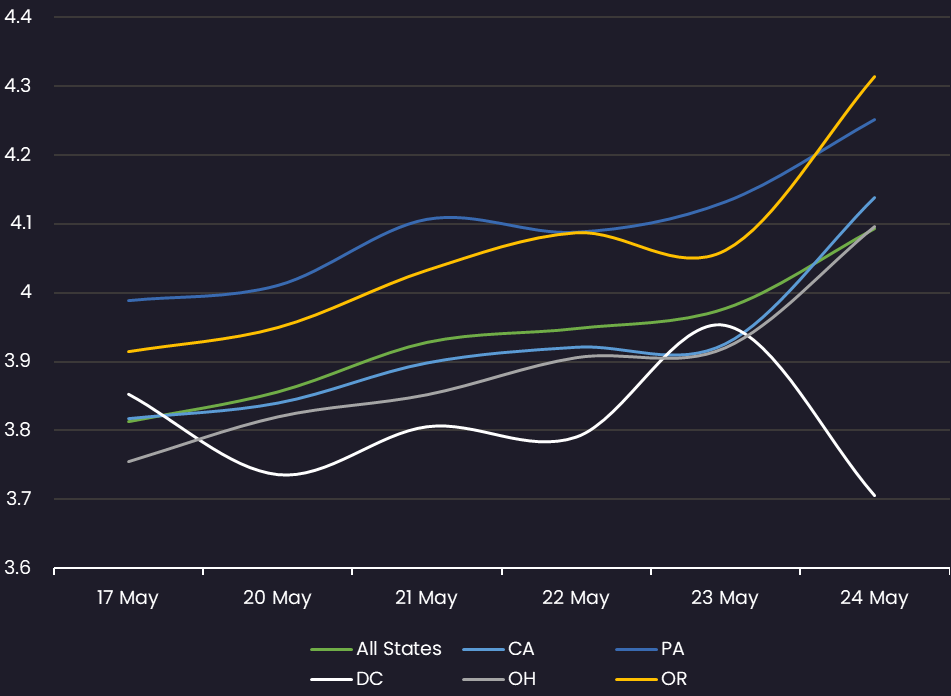
10 Year Yield by State – All
Displays the average Muni 10 year yield by state between 5/17/24-5/24/24 (General Obligation and Revenue Bonds) Results are based on 5 select states, however, we offer data across all 50 states and U.S. territories
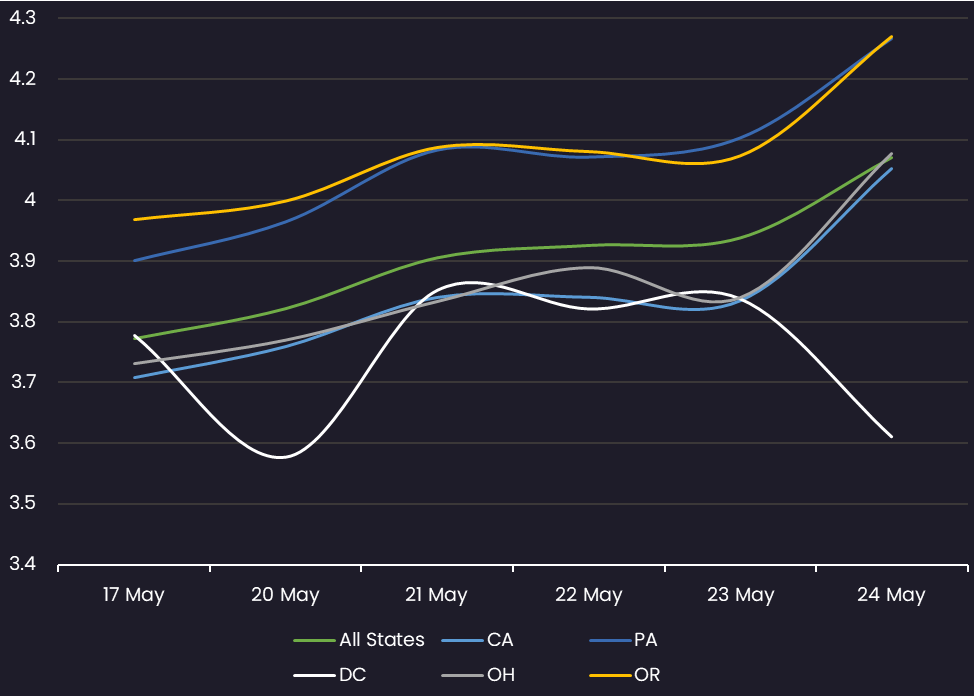
10 Year Yield by State – GO Only
Displays the average Muni 10 year yield by state between 5/17/24-5/24/24 (General Obligation Bonds only) Results are based on 5 select states, however, we offer data across all 50 states and U.S. territories
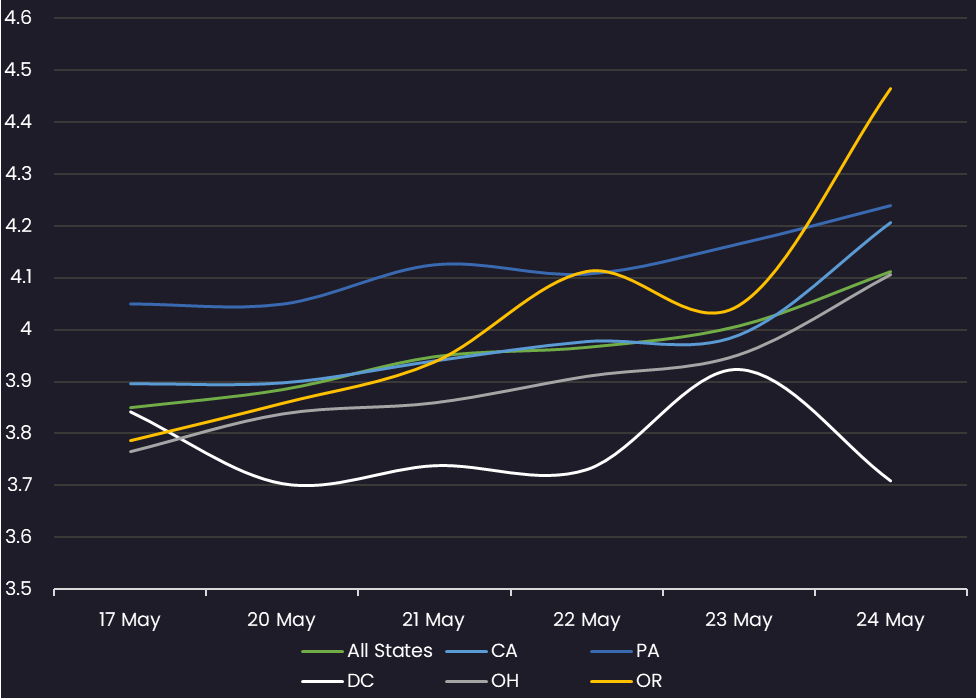
10 Year Yield by State – Rev Only
Displays the average Muni 10 year yield by state between 5/17/24-5/24/24 (Revenue Bonds only) Results are based on 5 select states, however, we offer data across all 50 states and U.S. territories
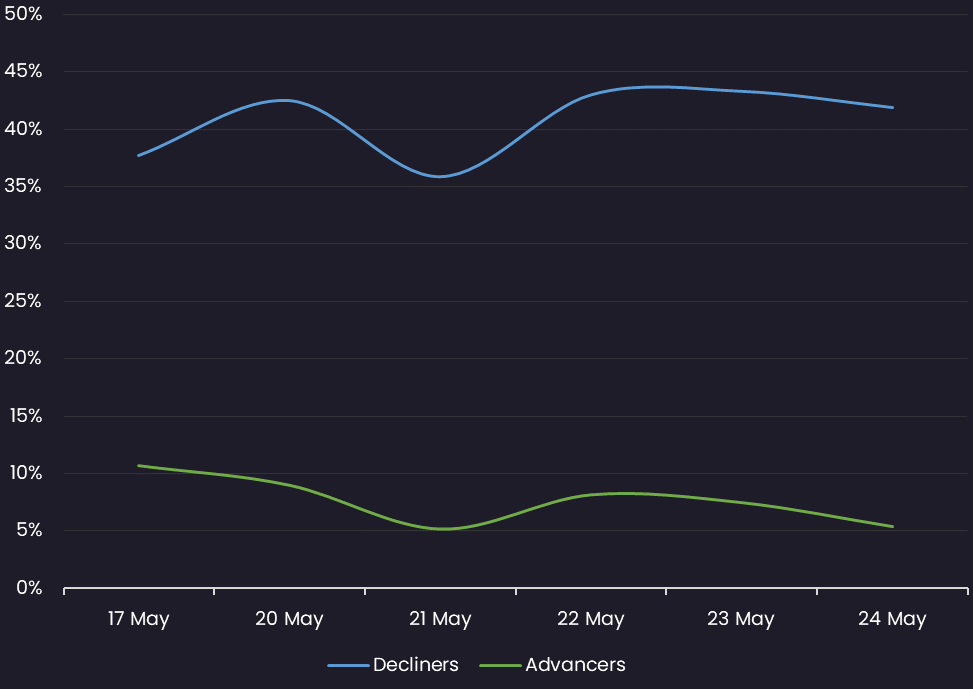
Sentiment
Reveals the percent of Muni bonds increasing in price (advancers) vs. decreasing in price (decliners) between 5/17/24-5/24/24
Top Quote Volume Movers: This Week vs Last Week
Exhibits the Munis with the largest increase in quote volume for the week ending 5/17/24 vs. the week ending 5/24/24
| RANK | TRANCHE | COUPON | MATURITY | PRIOR WEEK | THIS WEEK | INCREASE | % INCREASE |
|---|---|---|---|---|---|---|---|
| 1 | ECTOR CO ISD-A | 5.000% | 08/15/34 | 12 | 76 | 64 | 533% |
| 2 | IMPERIAL IRR DT-C-REF | 5.000% | 11/01/28 | 1 | 60 | 59 | 5900% |
| 3 | NTHRN CA TRANS-A-REF | 5.000% | 05/01/27 | 6 | 65 | 59 | 983% |
| 4 | PITTSBURG REF AGY-A | 5.000% | 09/01/28 | 1 | 60 | 59 | 5900% |
| 5 | LANCASTER REDEV AGY-A | 5.000% | 08/01/27 | 1 | 60 | 59 | 5900% |
| 6 | STOCKTON REDEV-A-REF | 5.000% | 09/01/28 | 1 | 60 | 59 | 5900% |
| 7 | ARCADIA USD-REF | 4.000% | 08/01/28 | 1 | 60 | 59 | 5900% |
| 8 | SAN LUIS OBISPO CNTY CALIF | 0.000% | 09/01/29 | 18 | 75 | 57 | 317% |
| 9 | FORT LAUDERDALE-B | 5.000% | 09/01/28 | 9 | 65 | 56 | 622% |
| 10 | STOCKTON USD-B-REF | 5.000% | 08/01/27 | 5 | 61 | 56 | 1120% |
Most Quoted Munis
Ranks the Munis that were quoted by the highest number of dealers between 5/17/24 – 5/24/24
| RANK | TRANCHE | COUPON | MATURITY | DEALERS |
|---|---|---|---|---|
| 1 | CALIFORNIA ST-REF | 5.000% | 09/01/35 | 40 |
| 2 | CALIFORNIA ST-REF | 5.000% | 09/01/43 | 39 |
| 3 | LA PAZ IDA-REF-TXBL | 6.900% | 12/01/34 | 38 |
| 4 | NEW JERSEY EDUCTNL-B | 4.000% | 03/01/53 | 37 |
| 5 | CALIFORNIA CMNTY CHOI | 4.000% | 02/01/52 | 36 |
| 6 | LOS ANGELES UNIF SD-A | 5.000% | 07/01/32 | 36 |
| 7 | LOS ANGELES UNIF SD-A | 5.000% | 07/01/34 | 36 |
| 8 | HOUSTON HGR EDU FIN C | 5.000% | 05/15/34 | 35 |
| 9 | NY ENVRNMNTL FACS-A | 5.250% | 06/15/53 | 35 |
| 10 | TRIBOROUGH BRIDGE-B-1 | 4.125% | 05/15/54 | 34 |
Stay up-to-date with weekly summaries.
Related Resources
About SOLVE
SOLVE is the leading market data platform provider for fixed-income securities, trusted by sophisticated buy-side and sell-side firms worldwide. Founded in 2011, SOLVE leverages its AI-driven technology and deep industry expertise to offer unparalleled transparency into markets, reduce risk, and save hundreds of hours across front-office workflows. With the largest real-time datasets for Securitized Products, Municipal Bonds, Corporate Bonds, Syndicated Bank Loans, Convertible Bonds, CDS, and Private Credit, SOLVE empowers clients to transform the way they bring new securities to market, trade on secondary markets, and value highly illiquid securities. Headquartered in Connecticut, with offices across the globe, SOLVE is the definitive source for market pricing in fixed-income markets.
