Syndicated Bank Loan Market Summary – Week Ending 9/15/23
GET OUR BANK LOAN MARKET SUMMARIES STRAIGHT TO YOUR INBOX. LEARN MORE
Syndicated Bank Loan Market Summary: Week Ending 9/15/23
Our newsletter presents key trends derived from observable Syndicated Bank Loan pricing data over a weekly period.
New Issues
Loans issued during the week ending 9/15/23
| ISSUER | AMOUNT (MM) | LOAN TYPE | MATURITY | RATE |
|---|---|---|---|---|
| Restaurant Brands Intl. Inc. | 5163 | Term Loan | 9/1/2030 | S+225 |
| Sally Holdings LLC | 399 | Term Loan | 2/28/2030 | S+225 |
| Tecomet Inc. | N/A | Term Loan | 12/23/2026 | N/A |
forward calendar
Forward calendar during the week ending 9/15/23
| Issuer | Deal Information | Banks | Expected Issue Date |
|---|---|---|---|
| Aercap (Delos Aircraft Designated Activity Co.) | $600MM TLB (BBB) | JPM,RBC,DB,MS | Q3 2023 |
| Alight Inc. (Tempo Acquisition LLC) | $2.5B TLB | BofA | Q3 2023 |
| Aramark Uniform Services | $1.8B credit facilities: $300MM RC; $1.5B TL | N/A | Q3 2023 |
| CHG Healthcare | $580MM TL (B2/B) | GS,JPM,BCLY,BMO,CITI | Q3 2023 |
| EnergySolutions LLC | $640MM TLB (B2/B) | N/A | Q3 2023 |
| Simon & Schuster | $1.1B credit facilities | JEFF,KKR,UBS,HSBC,RBC | Q3 2023 |
| Spring Education Group | $950MM credit facilities: $100MM RC; $850MM TLB | MACQ,GS | Q3 2023 |
Largest Loans
Highlights the weekly price movements and quote depth for the 20 largest bank loans between 9/8/23 – 9/15/23
| RANK | SIZE (MM) | NAME | CHANGE | PX | PX-1W | DEALERS |
|---|---|---|---|---|---|---|
| 1 | 7,270 | MEDLINE TL B | 0.07% | 100.01 | 99.94 | 12 |
| 2 | 5,900 | ATHENAHEALTH TL | 0.08% | 98.77 | 98.69 | 10 |
| 3 | 5,000 | QWEST CORPORATION TL B | 5.93% | 69.40 | 65.52 | 13 |
| 4 | 5,000 | UNITED CONTINENTAL TL B | 0.03% | 100.22 | 100.19 | 12 |
| 5 | 4,750 | ZAYO TL | 1.14% | 80.62 | 79.71 | 15 |
| 6 | 4,415 | ICON PLC TL B | 0.09% | 100.21 | 100.11 | 10 |
| 7 | 3,900 | DIRECTV TL | -0.10% | 98.70 | 98.80 | 15 |
| 8 | 3,515 | LIFEPOINT HOSPITALS TL B | 0.39% | 99.64 | 99.25 | 11 |
| 9 | 3,500 | PILOT TRAVEL TL B | 0.01% | 99.97 | 99.96 | 11 |
| 10 | 3,500 | AMERICAN AIRLINES TL B | -0.06% | 103.81 | 103.88 | 12 |
| 11 | 3,450 | GOLDEN NUGGET INC TL B | 0.62% | 99.81 | 99.20 | 15 |
| 12 | 3,420 | RCN GRANDE TL | 1.03% | 82.49 | 81.65 | 13 |
| 13 | 3,380 | SOLERA TL B | 0.18% | 97.45 | 97.28 | 12 |
| 14 | 3,300 | NTL CABLE PLC TL N | 1.78% | 98.96 | 97.24 | 11 |
| 15 | 3,190 | INTELSAT EXIT TL B | -0.03% | 99.94 | 99.98 | 12 |
| 16 | 3,100 | TRANSUNION TL B6 | 0.03% | 100.16 | 100.13 | 14 |
| 17 | 3,100 | HUNTER DOUGLAS TL B | 0.76% | 97.88 | 97.14 | 10 |
| 18 | 3,100 | ASURION TL B8 | 0.77% | 98.40 | 97.65 | 11 |
| 19 | 3,000 | DELTA SKYMILES TL B | -0.14% | 103.80 | 103.95 | 13 |
| 20 | 3,000 | WESTINGHOUSE TL B | 0.03% | 99.96 | 99.93 | 14 |
| AVERAGE | 3,939 | 0.63% | 96.51 | 96.01 | 12.3 |
Top 10 Performers
Showcases the top 10 loan performers based on the largest bid price increases between 9/8/23-9/15/23
| RANK | NAME | CHANGE | PX | PX-1W | DEALERS |
|---|---|---|---|---|---|
| 1 | TRINSEO TL B2 | 9.20% | 84.66 | 77.52 | 12 |
| 2 | GRANITE ACQUISITION TL B | 7.08% | 92.06 | 85.98 | 11 |
| 3 | TRILLIANT FOOD TL B | 6.56% | 84.18 | 79.00 | 4 |
| 4 | GREENWAY MEDICAL TL | 6.30% | 89.87 | 84.54 | 7 |
| 5 | SELECT STAFFING TL B | 6.15% | 89.86 | 84.66 | 11 |
| 6 | QWEST CORPORATION TL B | 5.93% | 69.40 | 65.52 | 13 |
| 7 | RIVERBED PIK TL | 4.47% | 62.56 | 59.89 | 4 |
| 8 | SECURUS TL | 4.10% | 91.06 | 87.48 | 6 |
| 9 | WHOLE EARTH BRANDS TL | 3.93% | 89.38 | 86.00 | 4 |
| 10 | MONEYGRAM TL B | 3.28% | 95.26 | 92.24 | 4 |
Bottom 10 Perfromers
Showcases the bottom 10 loan performers based on the largest bid price decreases between 9/8/23-9/15/23
| RANK | NAME | CHANGE | PX | PX-1W | DEALERS |
|---|---|---|---|---|---|
| 1 | THILEA TL B | -22.60% | 38.64 | 49.93 | 7 |
| 2 | HALO BUYER TL | -14.10% | 76.88 | 89.50 | 6 |
| 3 | JO-ANN STORES TL B | -5.97% | 32.04 | 34.07 | 6 |
| 4 | COMPREHENSIVE EYECARE PARTNERS TL | -2.34% | 74.93 | 76.72 | 11 |
| 5 | BABILOU EUR TL B | -1.68% | 96.94 | 98.60 | 9 |
| 6 | CIBT HOLDINGS TL A | -1.62% | 68.61 | 69.74 | 3 |
| 7 | HUBBARD RADIO TL B | -1.48% | 94.17 | 95.58 | 5 |
| 8 | INNOVATIVE XCESSORIES TL | -0.93% | 84.50 | 85.30 | 8 |
| 9 | PRESS GANEY TL | -0.63% | 97.34 | 97.95 | 6 |
| 10 | NTHRIVE TL B | -0.58% | 83.40 | 83.88 | 3 |
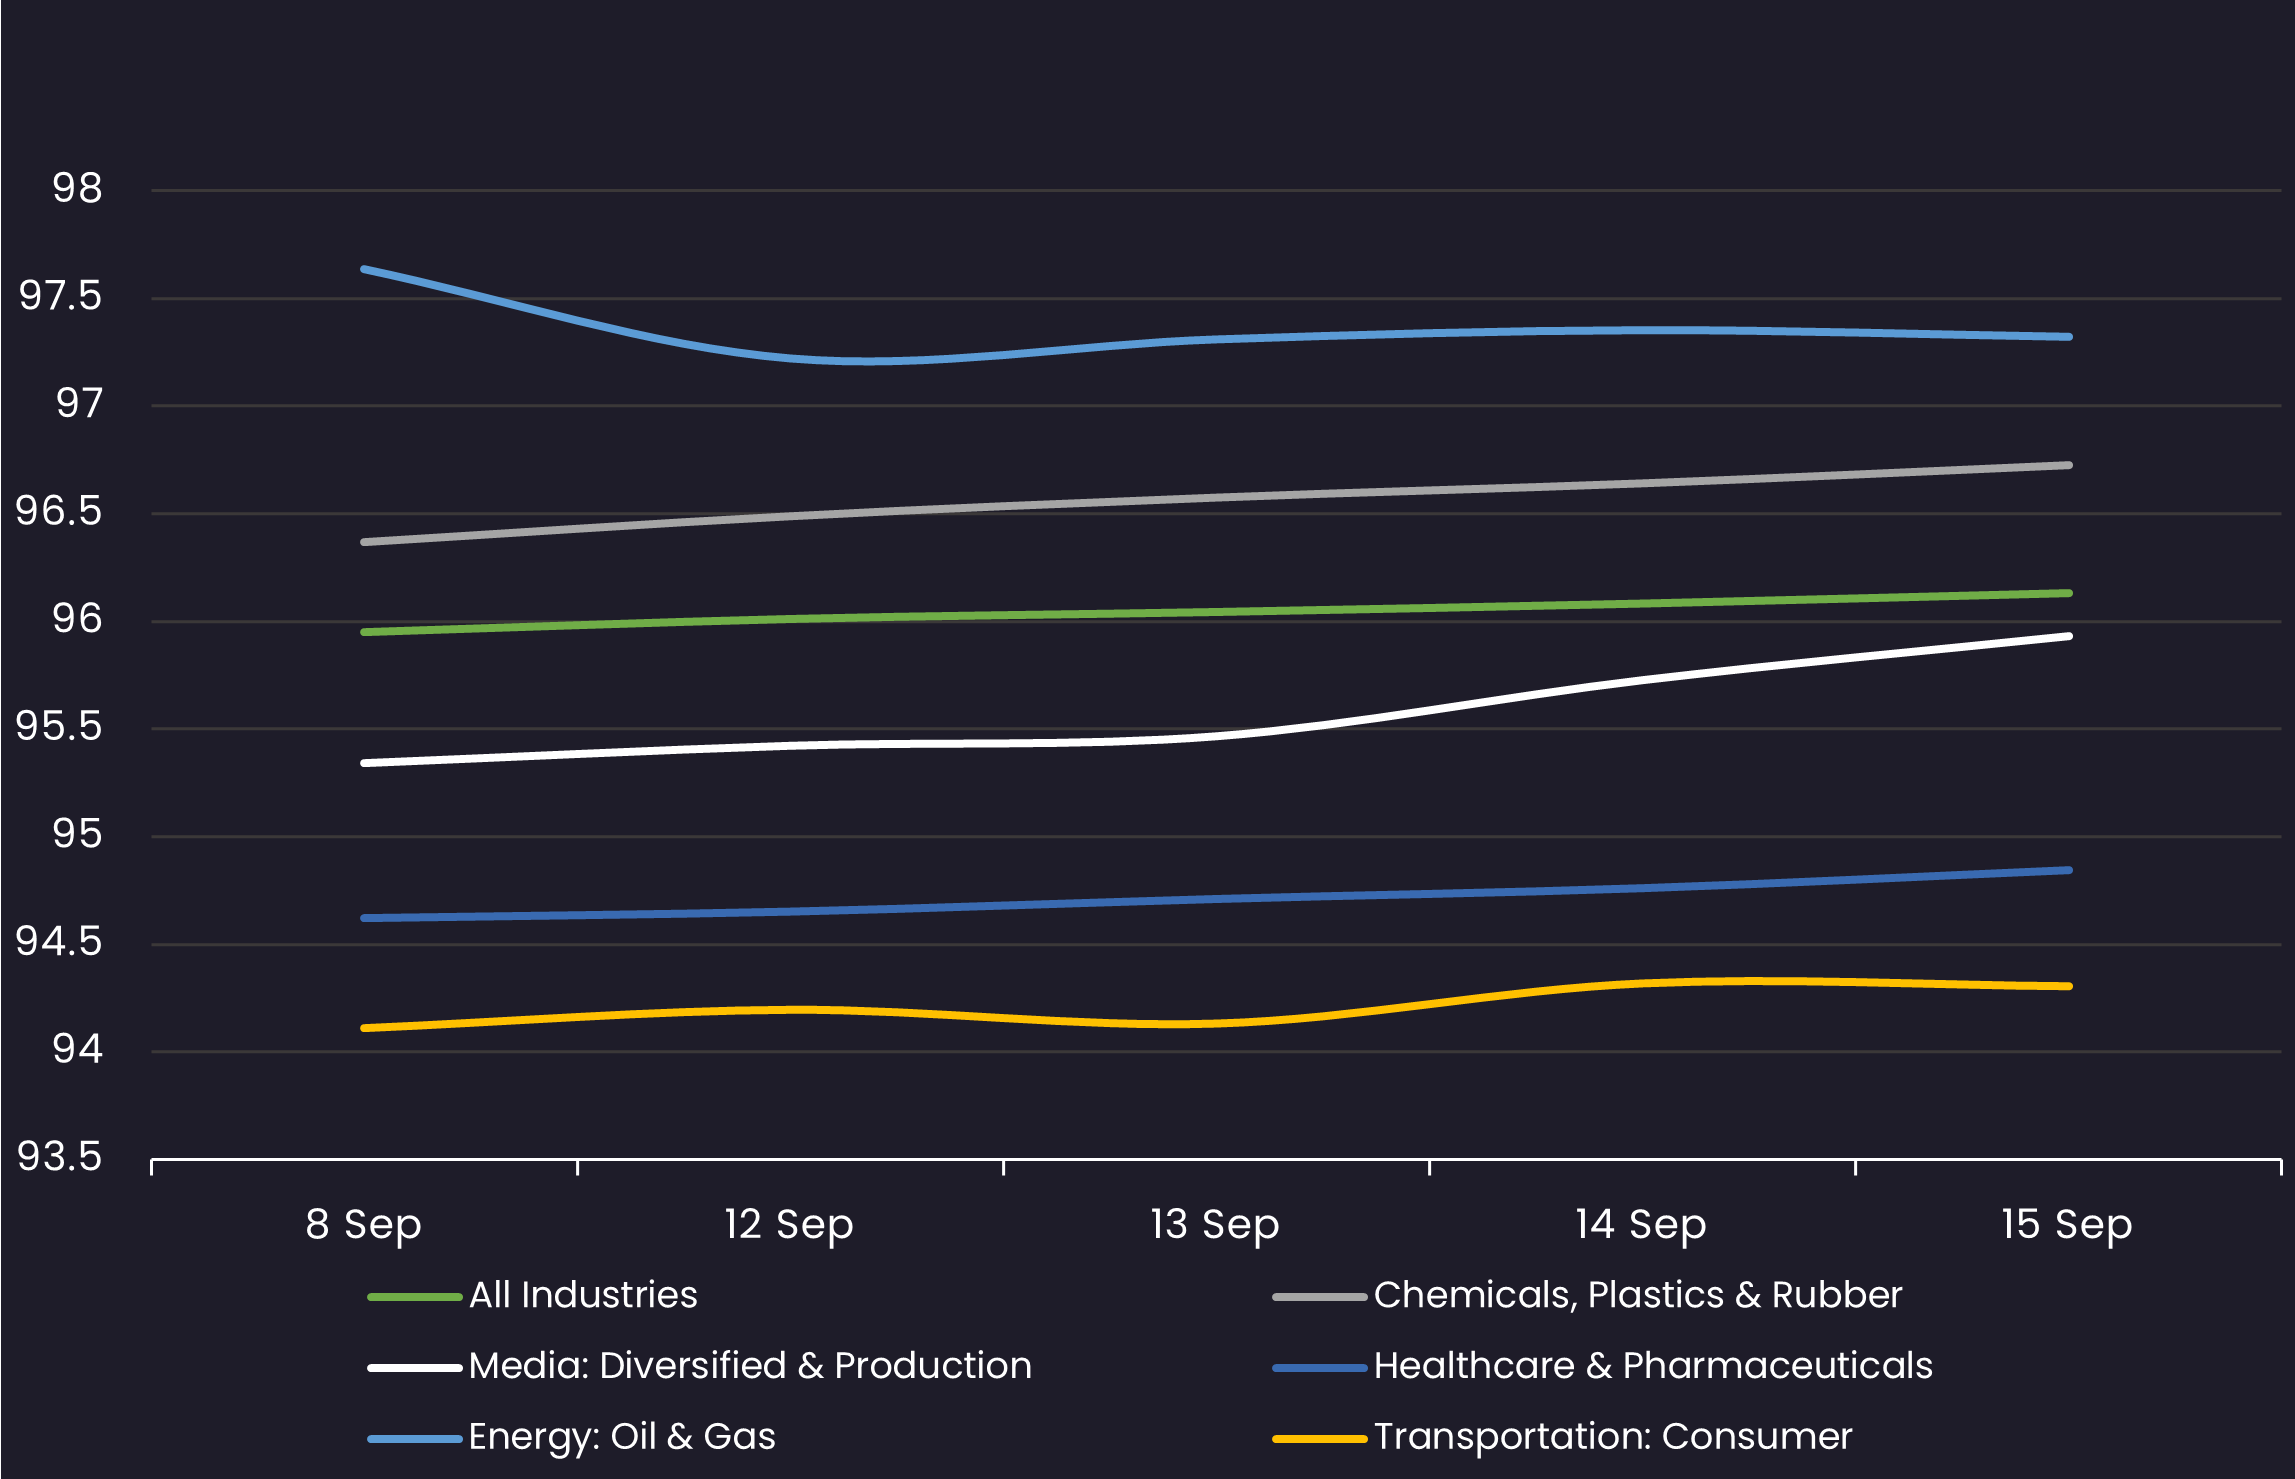
Avg Bid PX by Sector
Displays the average loan bid price by sector between 9/8/23-9/15/23 Results are based on 5 select industry sectors, however, we offer data across 36 sectors
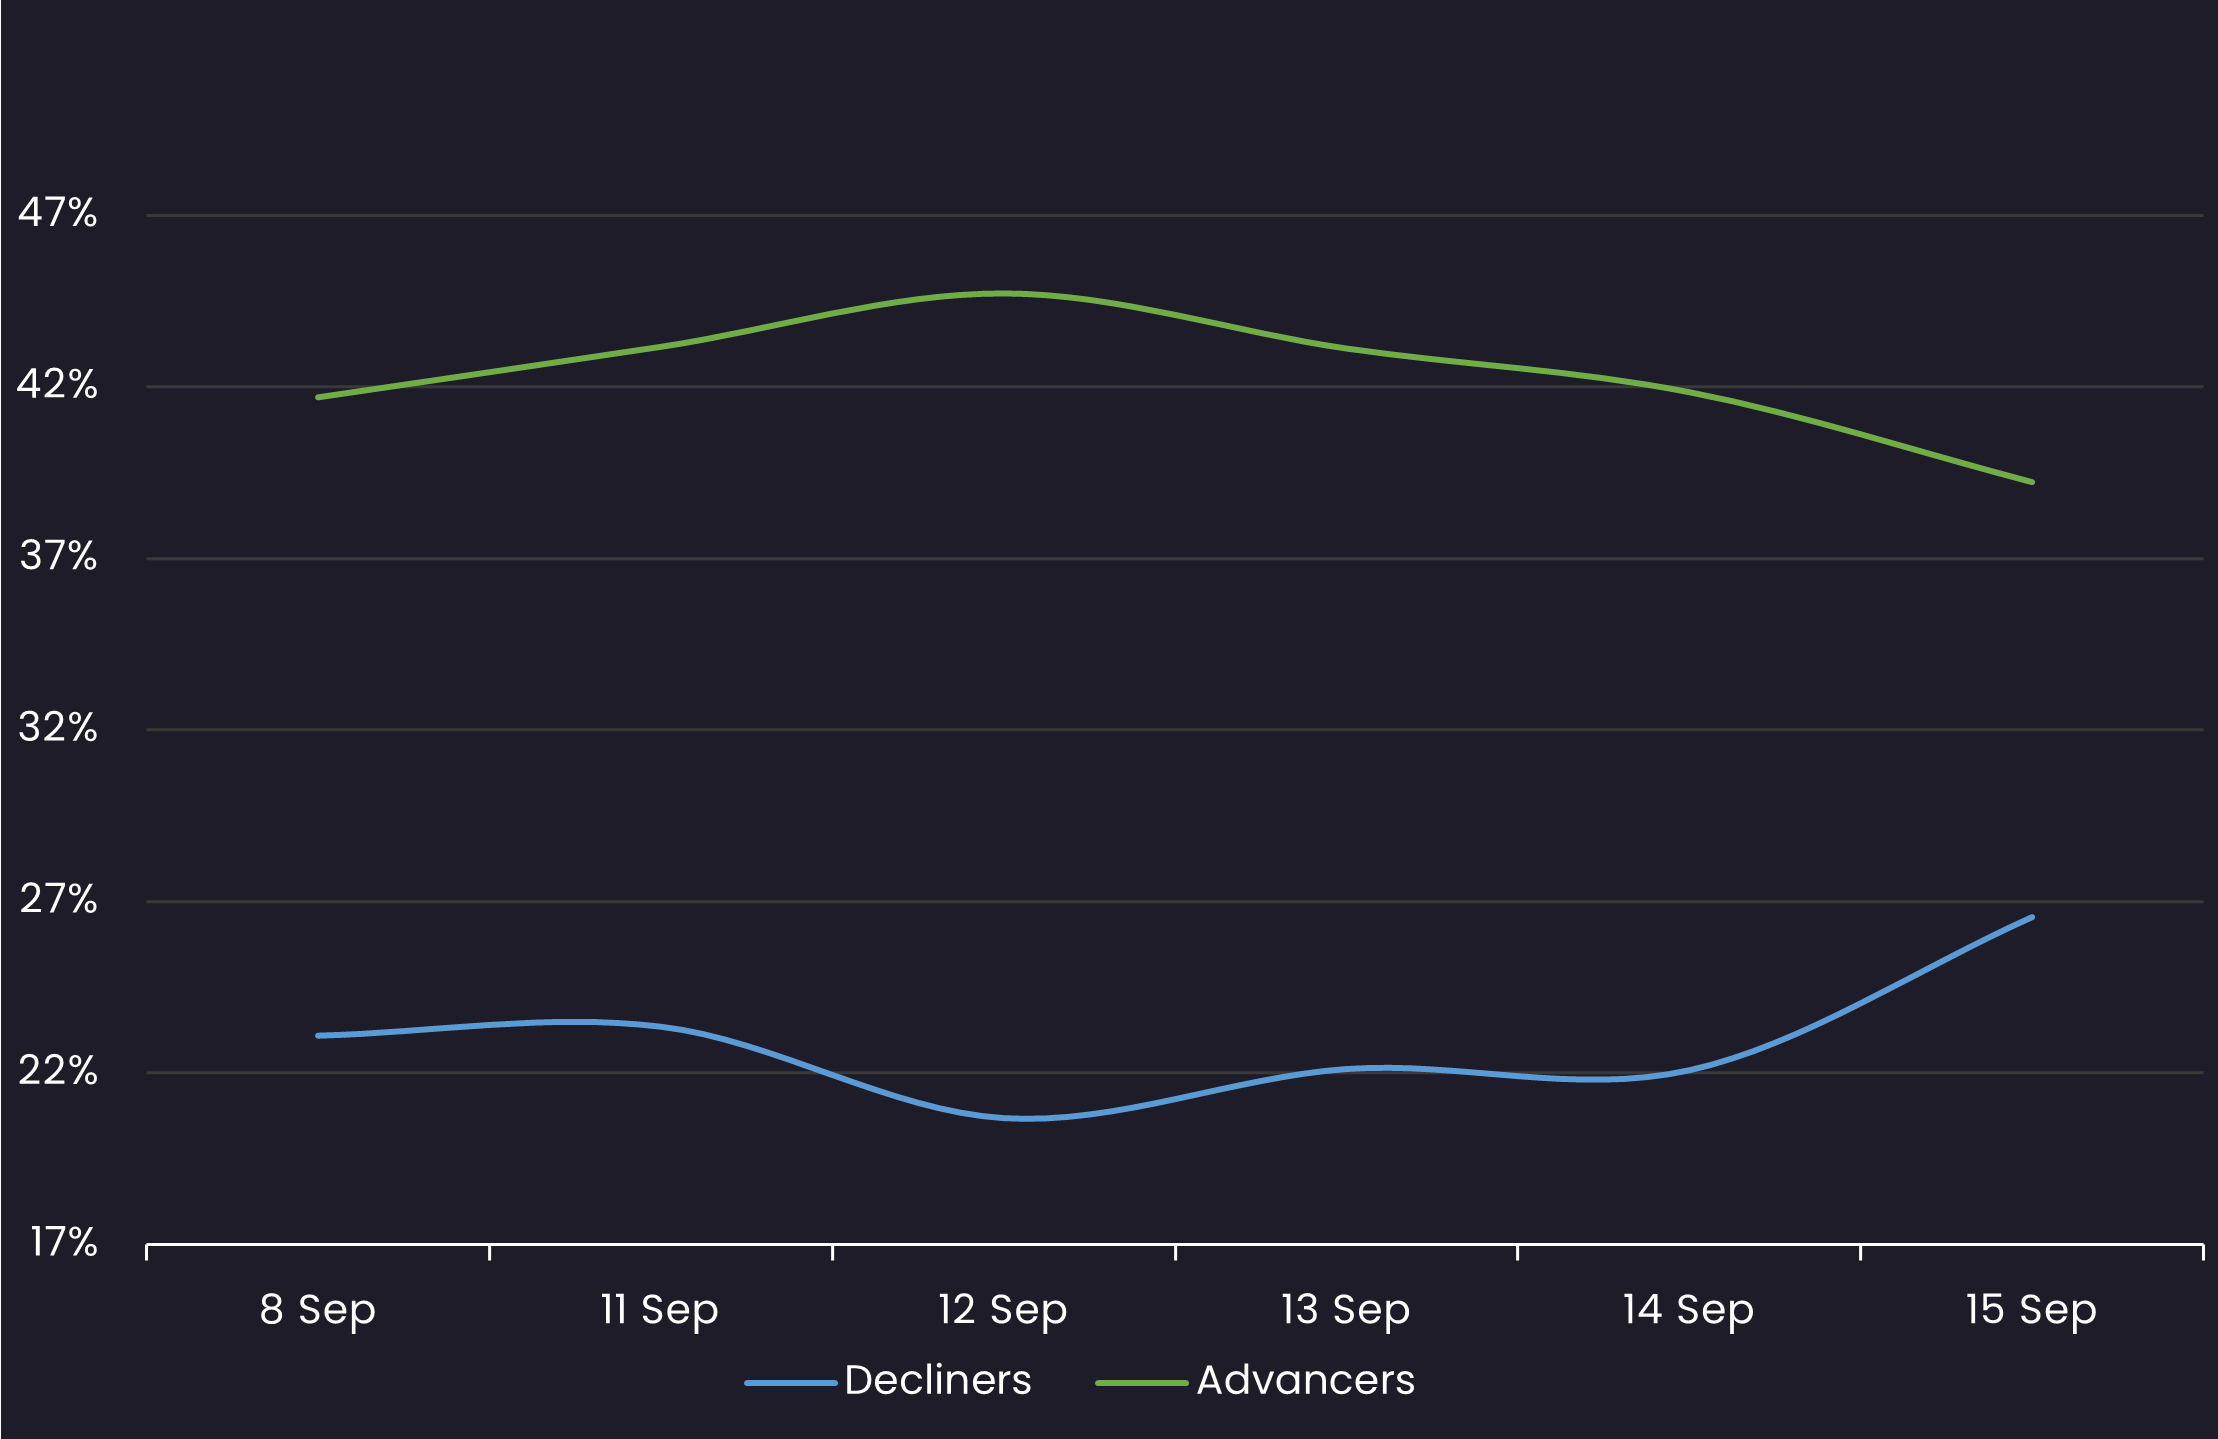
Sentiment
Reveals the percent of loans increasing in price (advancers) vs. loans decreasing in price (decliners) between 9/8/23-9/15/23
Top Quote Volume Movers: This Week vs Last Week
Exhibits the loans with the largest increase in quote volume for the week ending 9/8/23 vs. the week ending 9/15/23
| RANK | TRANCHE | PRIOR WEEK | THIS WEEK | INCREASE | % INCREASE |
|---|---|---|---|---|---|
| 1 | AVIENT CORP TL B7 | 23 | 74 | 51 | 222% |
| 2 | ENSEMBLE HEALTH TL | 15 | 63 | 48 | 320% |
| 3 | BERRY PLASTICS TL Z | 90 | 136 | 46 | 51% |
| 4 | CHARTER NEX TL | 27 | 68 | 41 | 152% |
| 5 | GO DADDY TL B5 | 19 | 58 | 39 | 205% |
| 6 | TRANSUNION TL B6 | 96 | 134 | 38 | 40% |
| 7 | GRAHAM PACKAGING TL B | 64 | 102 | 38 | 59% |
| 8 | ICON PLC TL B | 28 | 63 | 35 | 125% |
| 9 | GENESEE & WYOMING TL | 69 | 104 | 35 | 51% |
| 10 | HILEX POLY TL B | 112 | 146 | 34 | 30% |
Most Quoted Loans
Ranks the loans that were quoted by the highest number of dealers between 9/8/23-9/15/23
| RANK | TRANCHE | DEALERS |
|---|---|---|
| 1 | TRANSDIGM INC. TL I | 18 |
| 2 | ZIGGO EUR TL H | 18 |
| 3 | TELENET EUR TL | 18 |
| 4 | BELLIS ACQUISITION CO PLC EUR TL B | 17 |
| 5 | BMC SOFTWARE TL B | 17 |
| 6 | UPC HOLDING BV EUR TL | 17 |
| 7 | HILEX POLY TL B | 17 |
| 8 | ACTION NEDERLAND EUR TL B3 | 16 |
| 9 | NTL CABLE PLC GBP TL M | 16 |
| 10 | CEVA SANTE ANIMALE EUR TL B | 16 |
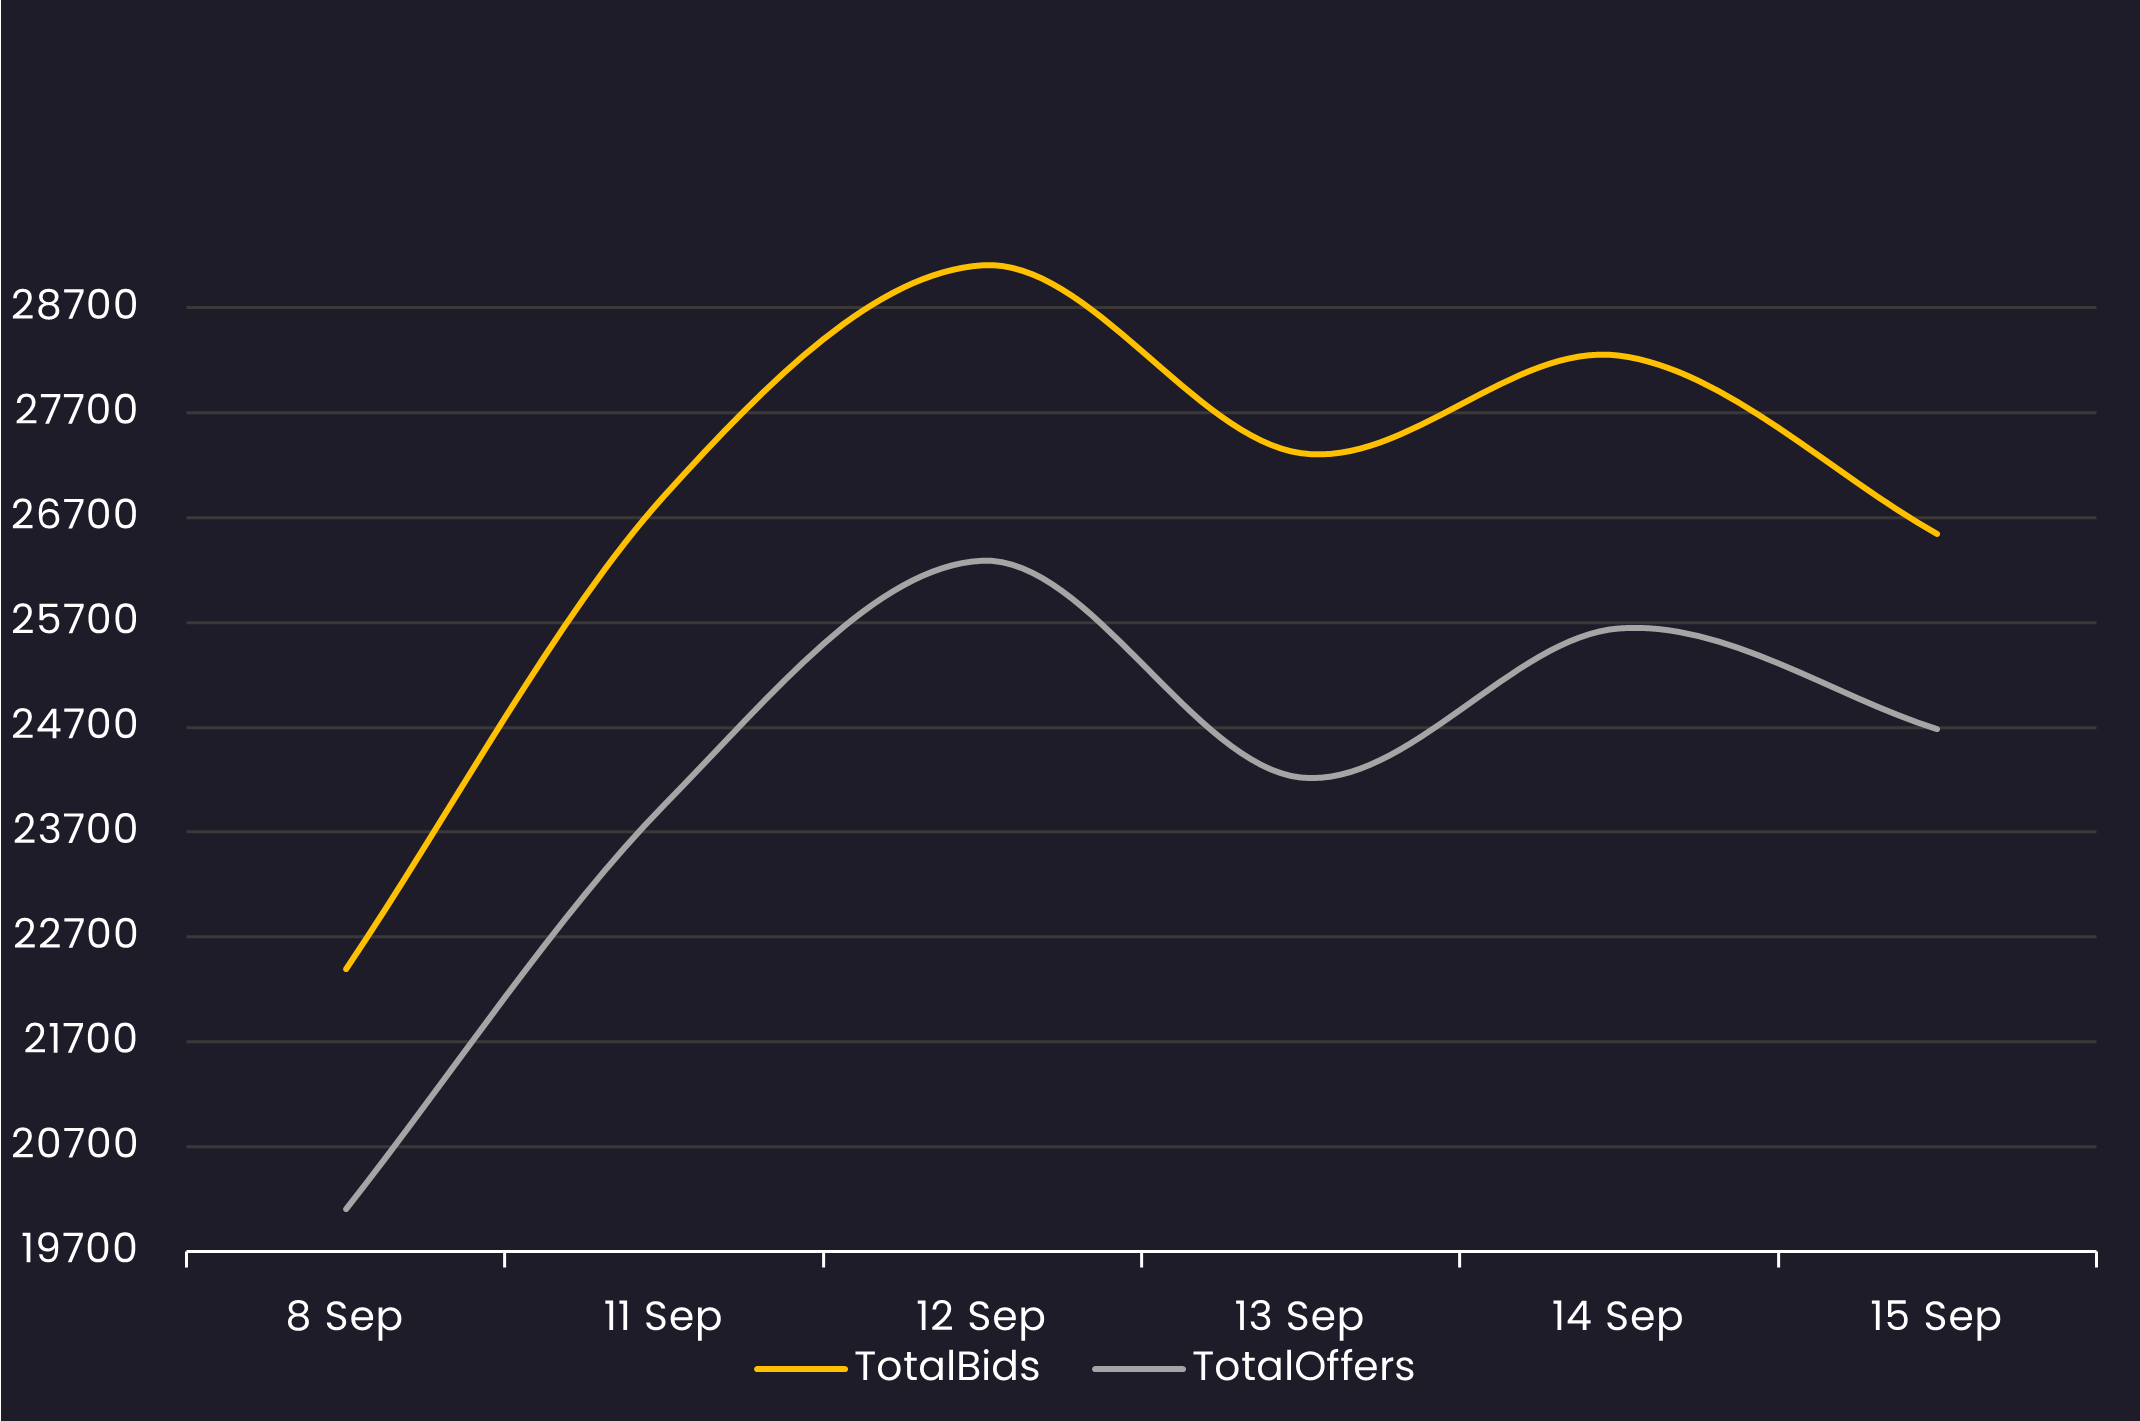
Bid and Offer Volume
Reveals the total number of quotes by bid and offer between 9/8/23-9/15/23
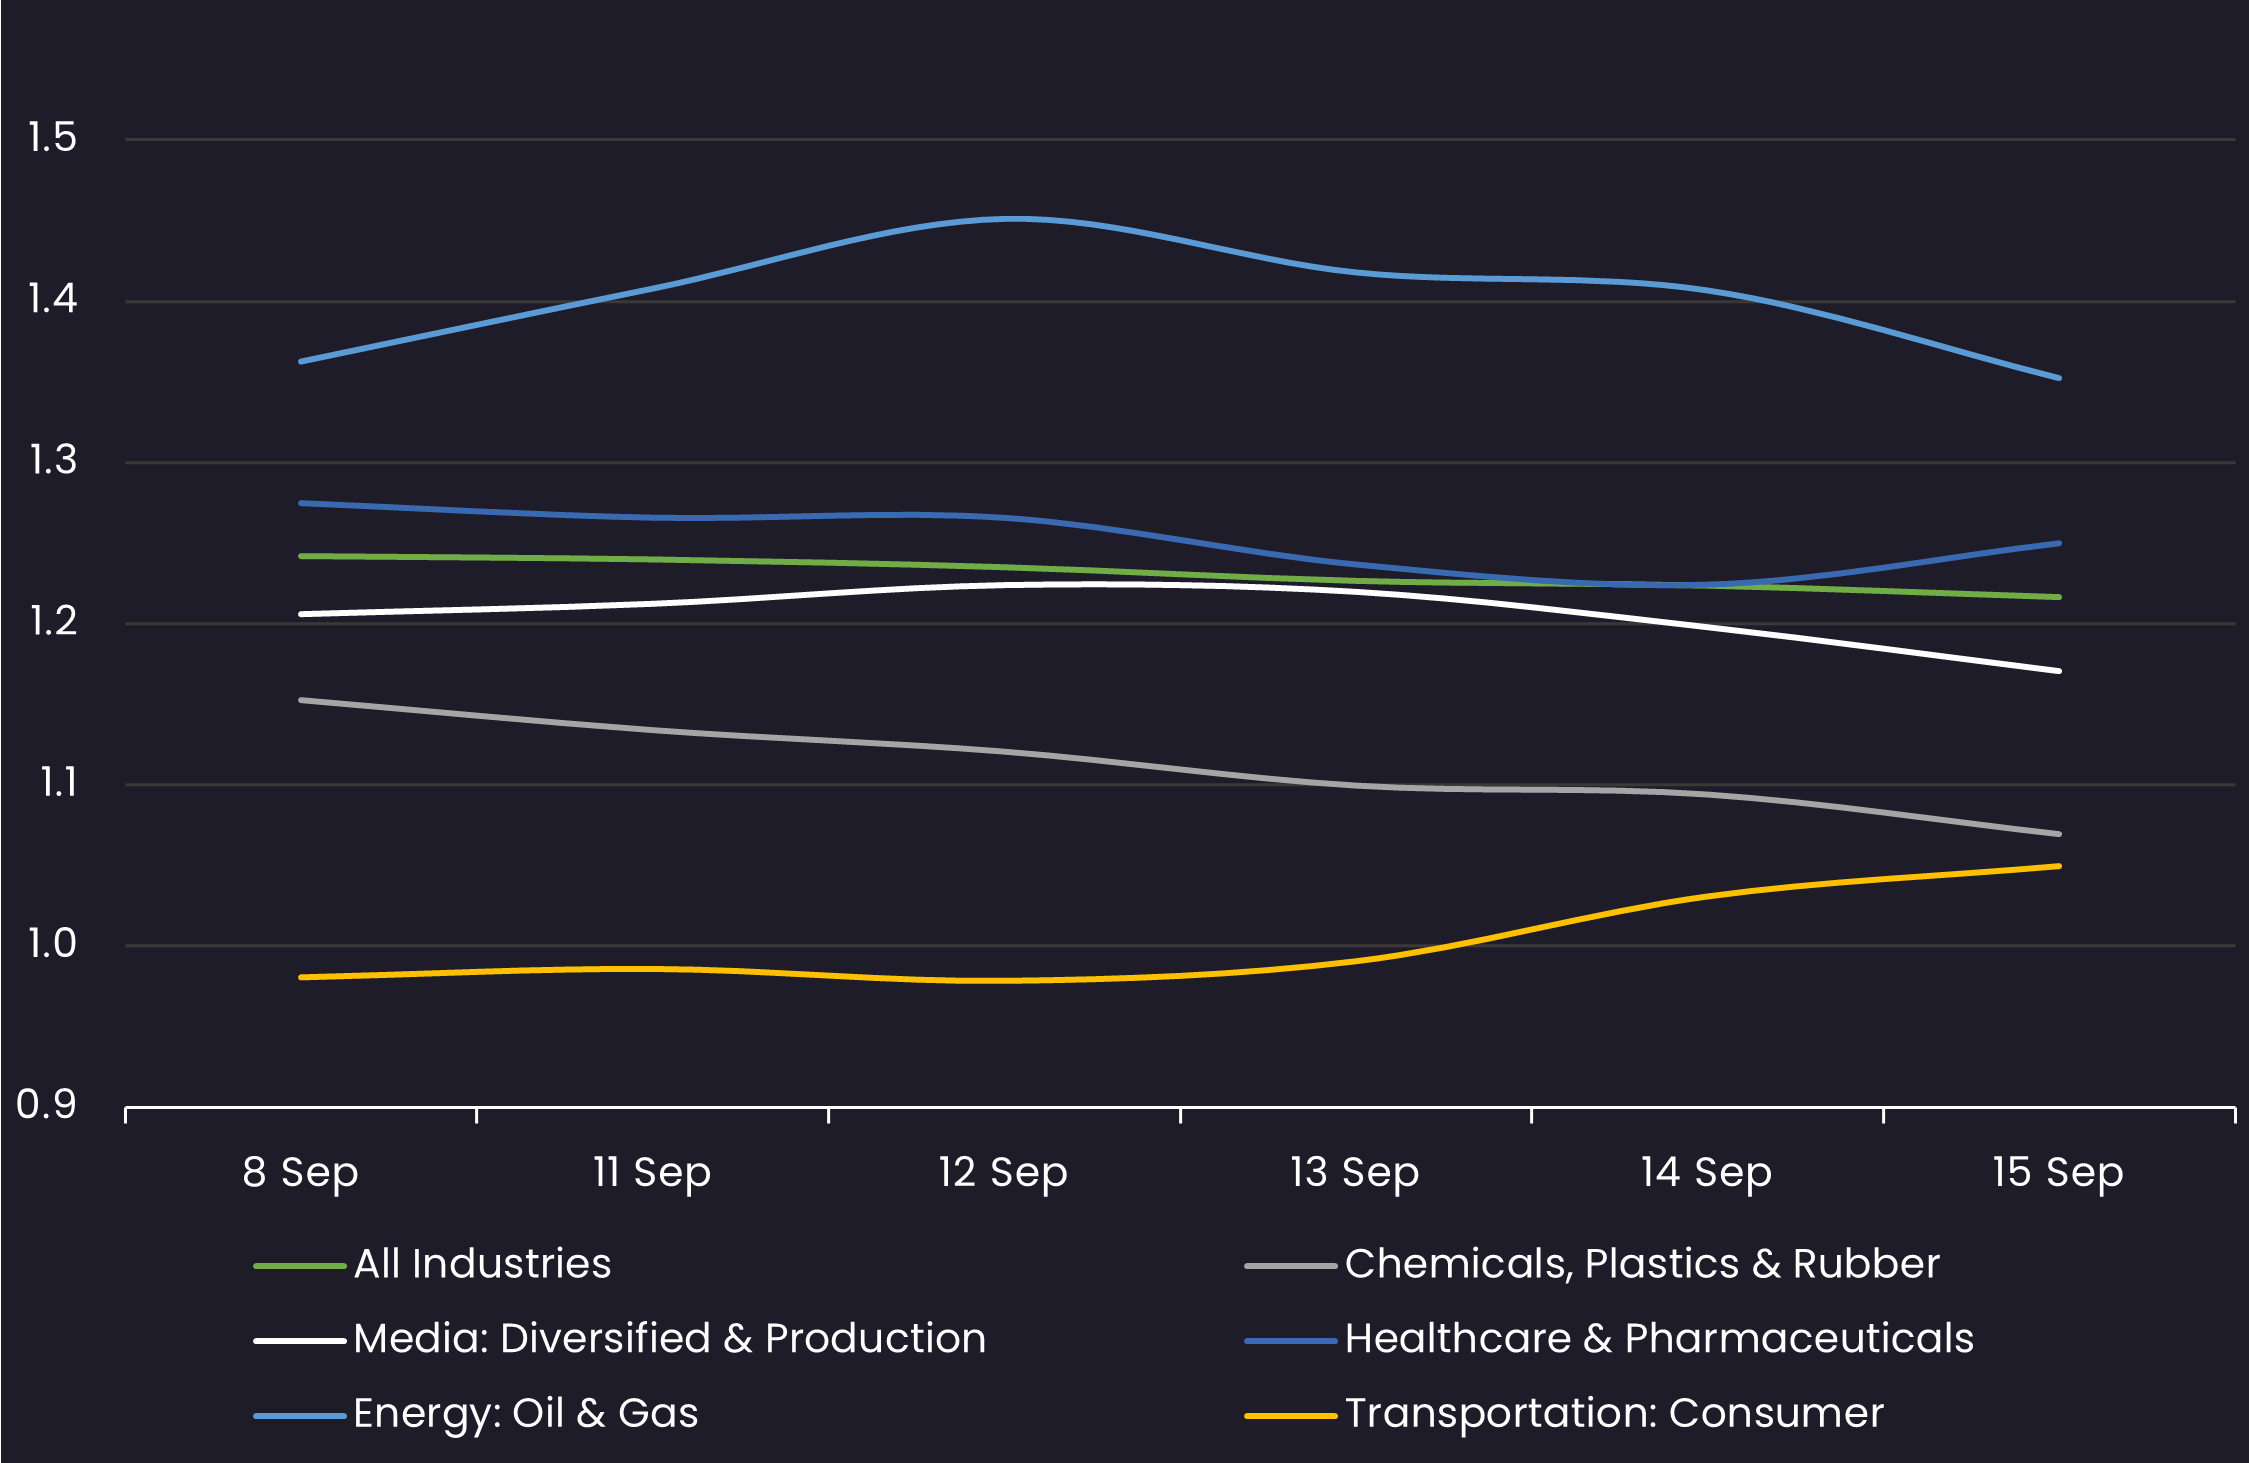
Sector Bid-Offer Spread
Results are based on 5 select industry sectors, however, we offer data across 36 sectors
Stay up-to-date with weekly summaries.
Related Resources
About SOLVE
SOLVE is the leading market data platform provider for fixed-income securities, trusted by sophisticated buy-side and sell-side firms worldwide. Founded in 2011, SOLVE leverages its AI-driven technology and deep industry expertise to offer unparalleled transparency into markets, reduce risk, and save hundreds of hours across front-office workflows. With the largest real-time datasets for Securitized Products, Municipal Bonds, Corporate Bonds, Syndicated Bank Loans, Convertible Bonds, CDS, and Private Credit, SOLVE empowers clients to transform the way they bring new securities to market, trade on secondary markets, and value highly illiquid securities. Headquartered in Connecticut, with offices across the globe, SOLVE is the definitive source for market pricing in fixed-income markets.
